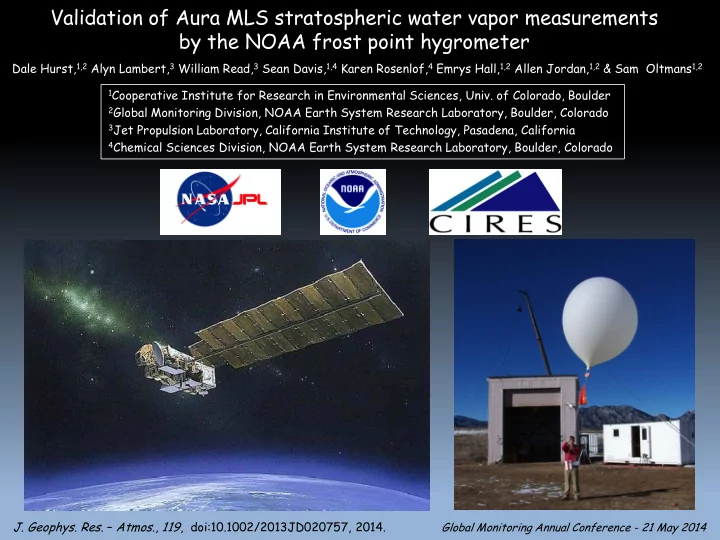

Validation of Aura MLS stratospheric water vapor measurements by the NOAA frost point hygrometer Dale Hurst, 1,2 Alyn Lambert, 3 William Read, 3 Sean Davis, 1,4 Karen Rosenlof, 4 Emrys Hall, 1,2 Allen Jordan, 1,2 & Sam Oltmans 1,2 1 Cooperative Institute for Research in Environmental Sciences, Univ. of Colorado, Boulder 2 Global Monitoring Division, NOAA Earth System Research Laboratory, Boulder, Colorado 3 Jet Propulsion Laboratory, California Institute of Technology, Pasadena, California 4 Chemical Sciences Division, NOAA Earth System Research Laboratory, Boulder, Colorado J. Geophys. Res . – Atmos ., 119 , doi:10.1002/2013JD020757, 2014. Global Monitoring Annual Conference - 21 May 2014
The Instruments Aura MLS Near-global coverage ~3500 profiles per day 316 hPa to well above 0.1 hPa Low vertical resolution (~3 km) MLS Water Vapor @ 83 hPa Operational since August 2004 NOAA FPH Three sites world-wide Boulder Monthly vertical profiles Hilo Surface to ~20 hPa High resolution (5-10 m) Lauder Boulder April 1980 –> Period of Comparison: Aug 2004 – Dec 2012 Hilo December 2010 -> Lauder August 2004 –> Global Monitoring Annual Conference - 21 May 2014
Coincidence Criteria for MLS Overpasses of FPH Sites * * * * * ∆ latitude <2°, ∆ longitude <8° * * * * ∆ t <16 hr from FPH launch * * * * * * N MLS = 9 * * * * * * Coincident MLS Profiles How to compare these 9 MLS profiles with one FPH profile? Distill the 9 profiles into one MLS median profile Global Monitoring Annual Conference - 21 May 2014
Comparing FPH Profiles with MLS Median Profiles Convolve the FPH FPH Profile profile with the MLS averaging kernels MLS Median Profile Resolution: 5-10 m How to compare this with the MLS profile? Global Monitoring Annual Conference - 21 May 2014
Creating Profile Comparison Groups Convolved FPH Profile Groups A and B group B requires 95% coverage of FPH data before AK applied this severely reduces FPH data availability at the highest altitudes MLS Coincident Profile Groups 1 and 2 group 2 employs slightly more relaxed spatial criteria but includes a matching criterion for Equivalent Latitude FPH-MLS Difference Groups FPH Profile Group A A1 MLS MLS A2 laxest criteria; largest Diff Group Profile Group 1 1 Profile Group 2 1 B1 strictest criteria; smallest Diff Group FPH Profile Group B B2 Total Coincident Profile Group 1 Coincident Profile Group 2 Site FPH Flights FPH Flights MLS Profiles FPH Flights MLS Profiles Boulder 135 115 634 130 1294 Hilo 24 23 105 23 193 Lauder 97 96 352 95 929 Global Monitoring Annual Conference - 21 May 2014
Evaluation of FPH–MLS Biases FPH–MLS: Group B1 Group A2 0.03 ppmv 0.8% -0.19 ppmv -0.32 ppmv Mean differences ± 95% confidence intervals Global Monitoring Annual Conference - 21 May 2014
Evaluation of Temporal Trends in FPH–MLS Slope ± 95% CI ppmv yr -1 FPH–MLS: Group B1 at 83 hPa (% yr -1 ) 0.01 ± 0.04 (0.2 ± 0.8%) -0.06 ± 0.39 (-1.4 ± 8.6%) -0.01 ± 0.05 (-0.3 ± 1.1%) Weighted Linear Regression Analyses Global Monitoring Annual Conference - 21 May 2014
Regression Slopes for FPH–MLS FPH–MLS: Group B1 Group A2 None of the B1 trends are statistically significant (95% confidence) Two statistically significant trends for A2 are inconsistent with B1 Global Monitoring Annual Conference - 21 May 2014
Minimum Detectable Trends From Weatherhead et al . [1998] N = record length σ Ν = std dev of residuals ω 0 = trend φ = autocorrelation coef N Avg Obs Trend ppmv yr -1 Avg MDT ppmv yr -1 Boulder 8.4 yr 0.03 ± 0.01 (0.6 ± 0.2%) 0.04 ± 0.01 Hilo 2.1 yr 0.08 ± 0.11 (1.7 ± 2.4%) 0.84 ± 0.24 Lauder 8.4 yr 0.02 ± 0.01 (0.3 ± 0.3%) 0.03 ± 0.01 Global Monitoring Annual Conference - 21 May 2014
Conclusions From 68 to 26 hPa the mean differences between FPH and MLS are <1% Statistically significant biases as large as 0.46 ppmv (10%) exist at 100 and 83 hPa over Boulder and Hilo and at 100 hPa over Lauder. Uncertainties of 10% in the abundance of water vapor in the UTLS have important implications for radiative transfer and climate models. The vast majority of trends in FPH–MLS differences are not statistically significant, but … Most trends determined here are smaller than the minimum trends currently detectable in these data sets. Global Monitoring Annual Conference - 21 May 2014
Recommend
More recommend