
SLIDE 1
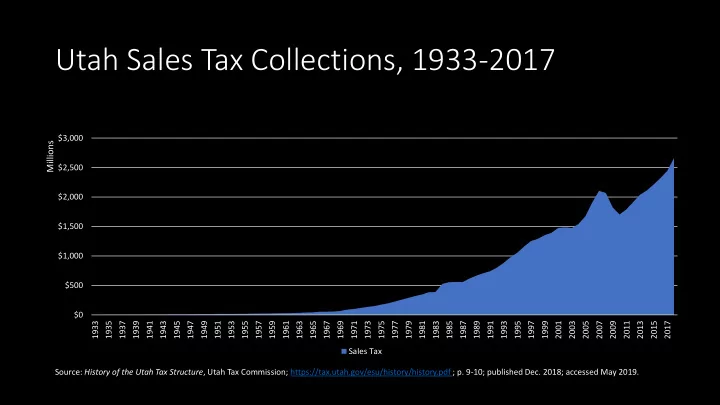
Utah Sales Tax Collections, 1933-2017
$0 $500 $1,000 $1,500 $2,000 $2,500 $3,000 1933 1935 1937 1939 1941 1943 1945 1947 1949 1951 1953 1955 1957 1959 1961 1963 1965 1967 1969 1971 1973 1975 1977 1979 1981 1983 1985 1987 1989 1991 1993 1995 1997 1999 2001 2003 2005 2007 2009 2011 2013 2015 2017
Millions
Sales Tax Source: History of the Utah Tax Structure, Utah Tax Commission; https://tax.utah.gov/esu/history/history.pdf ; p. 9-10; published Dec. 2018; accessed May 2019.