
SLIDE 1
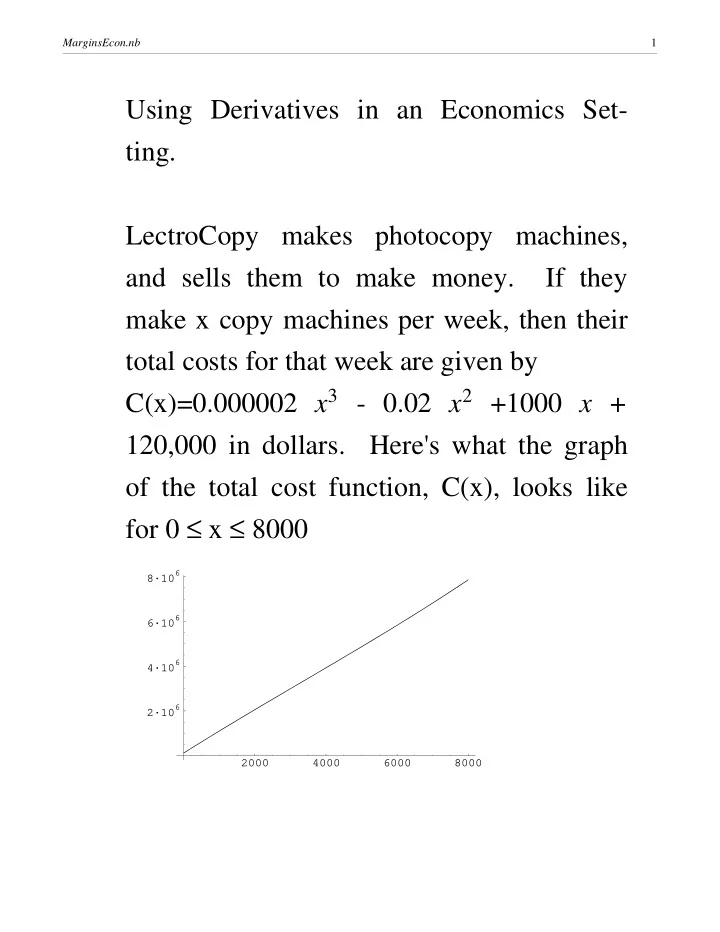
Using Derivatives in an Economics Set- ting. LectroCopy makes photocopy machines, and sells them to make money. If they make x copy machines per week, then their total costs for that week are given by C(x)=0.000002 x3 - 0.02 x2 +1000 x + 120,000 in dollars. Here's what the graph
- f the total cost function, C(x), looks like
for 0 ≤ x ≤ 8000
2000 4000 6000 8000 2·106 4·106 6·106 8·106 MarginsEcon.nb 1