using data to improve a global fire model for use in
play

Using Data to Improve a Global Fire Model for Use in Climate Models - PowerPoint PPT Presentation

Using Data to Improve a Global Fire Model for Use in Climate Models and ESMs Brian Magi 1,2 , Elena Shevliakova 1,2 , Sergey Malyshev 1,2 , Stephen Pacala 1 , Ronald Stouffer 2 1 Princeton University, Princeton, New Jersey, USA 2 NOAA Geophysical


  1. Using Data to Improve a Global Fire Model for Use in Climate Models and ESMs Brian Magi 1,2 , Elena Shevliakova 1,2 , Sergey Malyshev 1,2 , Stephen Pacala 1 , Ronald Stouffer 2 1 Princeton University, Princeton, New Jersey, USA 2 NOAA Geophysical Fluid Dynamics Lab (GFDL), Princeton, New Jersey, USA Presentation at NOAA ESRL GMD Annual Conference, 18 May 2011 
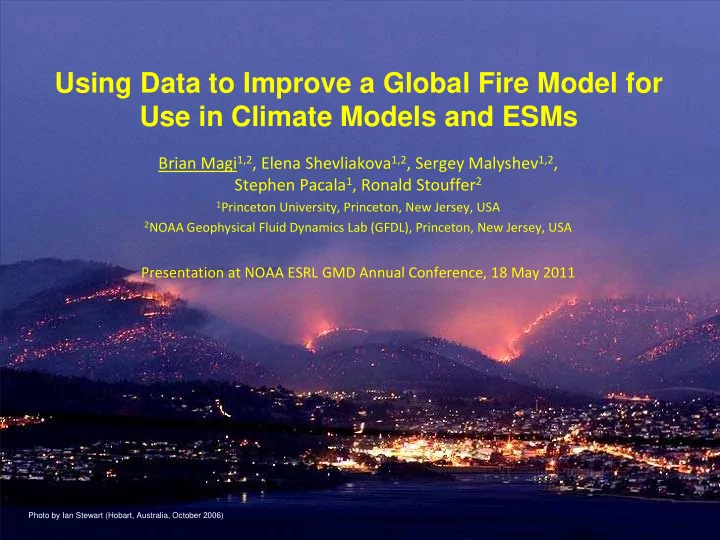
Photo by Ian Stewart (Hobart, Australia, October 2006)

  2. NOAA GFDL Earth System Model source: John Dunne et al., 2011, in preparation.

  3. Fire as a Land-Atmosphere Process •carbon cycle •meteorological conditions •surface albedo •availability of vegetation •vegetation cover •ignition source •soil and sediment fire land climate atmosphere •trace gases •land cover change •aerosol •vegetation type •air quality •radiative forcing •thermodynamics •atmospheric circulation

  4. Global Distribution of Fires As Seen From Satellite Fire counts (number/gridcell/year) Figure created using 2000-2009 thermal anomaly data from the MODIS instruments on the Terra and Aqua satellites (e.g. Giglio et al., 2006)

  5. Regional Aerosol Optical Depths from Model and Satellites USA and Canada Fire counts (number/gridcell/year) Siberia Sahel Africa South America Southern Africa Model (GFDL AM3) Satellite Mean Model AM3 described by Donner et al., J. Climate, 2011; Satellite mean includes AOD products from Terra MODIS, Aqua MODIS, and Terra MISR.

  6. NOAA GFDL Land Model secondary primary crop, pasture Reference: Elena Shevliakova et al., 2009.

  7. Improving the Simulation of Fire in the Land Model secondary primary crop, pasture Reference: Elena Shevliakova et al., 2009.

  8. Fire Model Schematic inputs -lightning (OTD/LIS) -population density (HYDE) -meteorology (T, q, precip) -crop residue burning (YL2003) deforestation -land use (H2006) primary crop, pasture secondary climate climate climate ignition ignition ignition fire size fire size fire size residue burned area burned area burned area burned area constraints -satellite products total burned area -ground-based data - fire agency reports References: Magi et al., in preparation, 2011; OTD/LIS from NASA; HYDE3.1 described by Klein Goldewijk et al. 2010; YL2003 is Yevich and Logan, 2003; H2006 is Hurtt et al., 2006.

  9. Annual Burned Area Simulated by the Fire Model Fire Model Burned Area r = 0.61 Annual Burned Area (Mha) fraction of gridcell burned (0-1) fire model (411 Mha*) Key Points •Spatial correlation with GFED3.1 is 0.61 •Burned area simulated by the fire model is within the range (285-408 Mha*) of satellite-based estimates from GFED3.1, r = 0.89 GFED3.1 (355 Mha*) L3JRC, GLOBCARBON, and MCD45 *1 Mha = 10,000 km 2 Years (2000-2009) References: Fire Model described in Magi et al., in preparation, 2011; GFED3.1 burned area from Giglio et al., 2010. Other burned area products are L3JRC (Tansey et al., 2008), MODIS MCD45 (Roy et al., 2008), and GLOBCARBON (Plummer et al., 2006).

  10. Month of Maximum Burned Area Climate Driven Fires Agricultural Fires J F M A M J J A S O N D Key Points •Tropical fire season peaks during the dry season, extratropical fire season during the hottest months •Agricultural fire season in the tropics peaks close to the peak of the dry season •Agricultural fire season in the extratropics peaks prior to and following the growing season References: Magi et al., in preparation, 2011.

  11. Mean Monthly Burned Area Simulated by the Fire Model Southern Hemisphere Northern Hemisphere Tropics Tropics Burned area (Mha/month) GFED3.1 GFED3.1 fire model total naturally-occuring agricultural Months Months References: Fire Model described in Magi et al., in preparation, 2011; GFED3.1 burned area from Giglio et al., 2010.

  12. Mean Monthly Burned Area Simulated by the Fire Model Central Asia Boreal North America (Ukraine to SE Russia) Burned area (Mha/month) GFED3.1 GFED3.1 fire model total agricultural naturally-occurring Months Months References: Fire Model described in Magi et al., in preparation, 2011; GFED3.1 burned area from Giglio et al., 2010.

  13. Fraction of Total Burned Area due to Agriculture fraction of burned area due to agriculture* * agriculture includes burned area from fires on cropland, pasture, and deforestation Key Point •Agricultural burning practices account for 69% of the total burned area References: Magi et al., in preparation, 2011.

  14. Apportionment of Global Carbon Emissions from Fires 2.8 Pg C/year Key Points •Total emissions estimated at 2.8 PgC/year (GFED3.1 is about 2 PgC/year) •Unintentional fires account for over 50% of the carbon emissions •Burning of crop residue and pastures account for 21-34% of global carbon emissions •Deforestation accounts for only 2% of total burned area, but 11% of carbon emissions References: Fire Model described in Magi et al., in preparation, 2011; GFED3.1 emissions from Van der Werf et al., 2010.

  15. Conclusions Summary: The improved fire model simulates seasonal fire as a mixture using empirical relationships, literature-based estimates, and parameter estimation Results from our mixture model 1. Present day fires are driven by climate, but are nearly entirely anthropogenic 2. Most of the anthropogenic burned area is due to agricultural practices 3. Agricultural fraction of total global burned area is 69%, while the fraction of total global emissions is about 45% 4. 11% of global emissions is from deforestation Future work on the fire model 1. Incorporation of the fire model as an interactive component in the GFDL Land Model and Earth System Model 2. Simulations of historical and future fire using land use scenarios and IPCC AR5 model output 3. Improve model of seasonal agricultural burning in different regions (China, India, southern Russia, Ukraine, Sub-Sahara Africa) 4. Improve model of deforestation

  16. Questions?

  17. Input and Datasets Used in the Fire Model T, q, snow GFDL ESM2M Dunne et al., in prep, 2011 land use HYDE, SAGE Hurtt et al., 2006 precipitation GPCP, rain gauges, TRMM Sheffield et al., 2006 lightning OTD, LIS on TRMM LIS website population HYDE 3.1 Klein Goldewijk et al., 2010 crop use bottom-up analysis Yevich and Logan, 2003 burned area GFED 3.1 Giglio et al., 2010 fire reports NIFC, CIFFC, RFF agency reports on internet fire counts Terra and Aqua MODIS Giglio et al., 2006

Download Presentation
Download Policy: The content available on the website is offered to you 'AS IS' for your personal information and use only. It cannot be commercialized, licensed, or distributed on other websites without prior consent from the author. To download a presentation, simply click this link. If you encounter any difficulties during the download process, it's possible that the publisher has removed the file from their server.

Recommend


More recommend