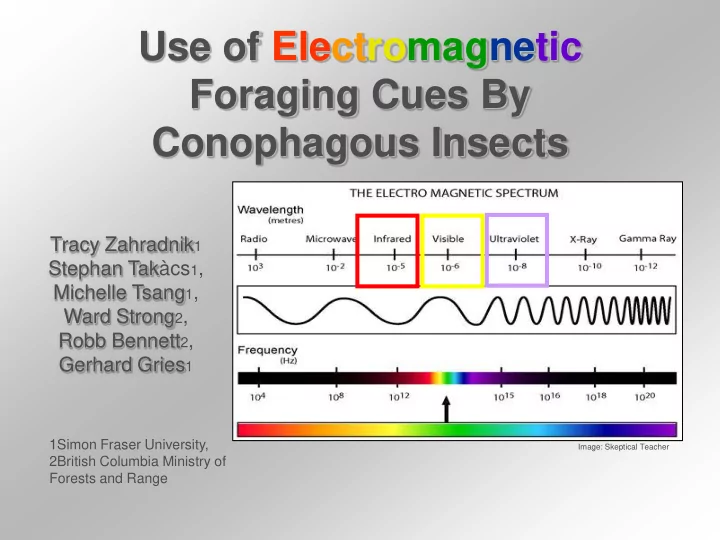

Use of Electromagnetic Foraging Cues By Conophagous Insects Tracy Zahradnik 1 Stephan Takàcs 1 , Michelle Tsang 1 , Ward Strong 2 , Robb Bennett 2 , Gerhard Gries 1 1Simon Fraser University, Image: Skeptical Teacher 2British Columbia Ministry of Forests and Range
Seed Orchards and The Insects • Leptoglossus occidentalis : seed orchard pest, both adults and nymphs eat conifer seeds, and are known to use Infrared radiation (IR) as a foraging cue (Takàcs et al., 2009) 21.0°C 20 18 16 14 12 10 Photo: Christopher Porter 8 8.0°C
Seed Orchards and The Insects • Contarinia oregonensis : seed orchard pest, midge, females oviposit on conifer cones and larvae eat the seed Photo: Dion Manastyrski • Dioryctria pseudotsugella : moth, conifer tree defoliator, larvae will eat cones Photo: Dick Willapalens
Field Trapping IR Experiments 20.3°C 5.9°C C. oregonensis attack Douglas-fir in early season when cones are receptive for fertilization and IR in cones is visible.
Field Trapping IR Experiments Cold Hot
Field Trapping IR Experiments 38.3°C Cold Hot 30 20 10 8.1°C 38.3°C 30 20 10 8.1°C
Field Trapping IR Experiments: C. Oregonensis Hot Traps Cold Traps 54 * Kalmalka n = 20 24 78 Saanichton 35 * Number of Contarinia oregonensis * p < 0.05
Field Trapping IR Experiments: D. pseudotsugella Hot Traps Cold Traps 6 Male * n = 20 0 0 Unmated Female 0 20 * Mated Female 2 Number of Dioryctria pseudotsugella * p < 0.05
Field Colour Preference: C. oregonensis 1 2 3 4 5
Field Colour Preference: C. oregonensis 7 Average Larvae per Cone 6 5 4 3 2 1 0 1 2 3 4 5 1 2 3 4 5
Electromagnetic Cues: Leptoglossus occidentalis • Findings from Takàcs et al. (2009) using similar experiments showed a preference in L. occidentalis for hot IR stimuli in the field trials and bioassays. • Electroretinograms can give the electrical potential of the eye indicating what an eye can see, not what an insect prefers. Amplitude LED Peak Amplitude 440nm 420 430 440 450 460 Wavelength (nm) Photo: Christopher Porter
Electroretinograms Photo: Christopher Porter
Average Responses of Male and Female Leptoglossus to Various Wavelenghts UV Visible Light 1.2 Ratio of Peak Amplitude 1 0.8 0.6 0.4 0.2 0 370 372 376 390 395 400 408 425 433 452 470 474 480 505 527 541 567 571 572 573 590 592 594 595 604 610 621 636 642 648 Wavelength (nm)
Mapping of Female Eyes 1 n = 10 Ratio of Response 0.8 Amplitude Dorsal 0.6 Ventral 0.4 Equitorial 0.2 0 390 433 474 505 527 572 592 621 Wavelength (nm)
Mapping of the Male Eyes 1 n = 10 Ratio of Response 0.8 Amplitude Dorsal 0.6 Ventral 0.4 Equitorial 0.2 0 390 433 474 505 527 572 592 621 Wavelength (nm)
Colour Selection Experiment: L. occidentalis Glass Plate Glass Plate ? 430nm 505nm peak peak LED LED Blue Green
Colour Selection Experiment: L. occidentalis 17 * Number of of Responders 11 9 Blue Green 3 Male Female * p < 0.05
Colour + IR Choice Experiment Mirror Mirror Glass Plate Glass Plate ? 430nm 505nm peak peak LED LED Blue Green Hot IR Source Cold IR Source
Colour + IR Choice Experiment Mirror Mirror Glass Plate Glass Plate ? 430nm 505nm peak peak LED LED Blue Green Cold IR Source Hot IR Source
Colour + IR Selection Experiment * 17 Blue Blue+Hot Blue+Cold Green Green+Cold Green+Hot Number of Responders 11 11 10 9 8 7 3 3 3 2 0 Male Female Male Female Male Female * p < 0.05
Colour + IR Selection Experiment p < 0.05 p > 0.05 p < 0.05 p < 0.05 p > 0.05 p > 0.05 17 Blue Blue+Hot Blue+Cold Green Green+Cold Green+Hot Number of Responders 11 11 10 9 * * 8 7 3 3 3 2 0 Male Female Male Female Male Female * p < 0.05
Average Responses of Male and Female Leptoglossus to Various Wavelenghts UV Visible Light 1.2 Ratio of Peak Amplitude 1 0.8 0.6 0.4 0.2 0 370 372 376 390 395 400 408 425 433 452 470 474 480 505 527 541 567 571 572 573 590 592 594 595 604 610 621 636 642 648 Wavelength (nm)
Colour + UV Selection Experiment Glass Plate Glass Plate ? 430nm 430nm peak LED Blue peak + LED Blue 390nm peak LED UV
Colour + UV Selection Experiment 6 6 5 5 Number of Responders Blue+UV Blue Male Female
Acknowledgements Caroline Whitehouse Forest Genetics Council of British Columbia Tamara Richardson British Columbia Ministry of Forest and Range Saanichton Nicole TunBridge British Columbia Ministry of Forest and Range Kalmalka, Audrey Labrie Vernon Jim Corrigan CANFOR Seed Orchard, Sechelt Patti Brown Simon Fraser University Tom Cowan Regine Gries
Recommend
More recommend