Urgent Care - Key System Performance Ambulance Activity - Handover - - PowerPoint PPT Presentation

urgent care key system performance
SMART_READER_LITE
LIVE PREVIEW

Urgent Care - Key System Performance Ambulance Activity - Handover - - PowerPoint PPT Presentation

Appendix 3 - presentation slides Urgent Care - Key System Performance Ambulance Activity - Handover Breaches - +1hr Apr May Jun Jul Aug Sep Oct Nov Dec Jan Feb Mar YTD 18,599 WMAS Activity 1,806 1,846 1,809 1,783 1,784 1,750


slide-1
SLIDE 1

Urgent Care - Key System Performance

1

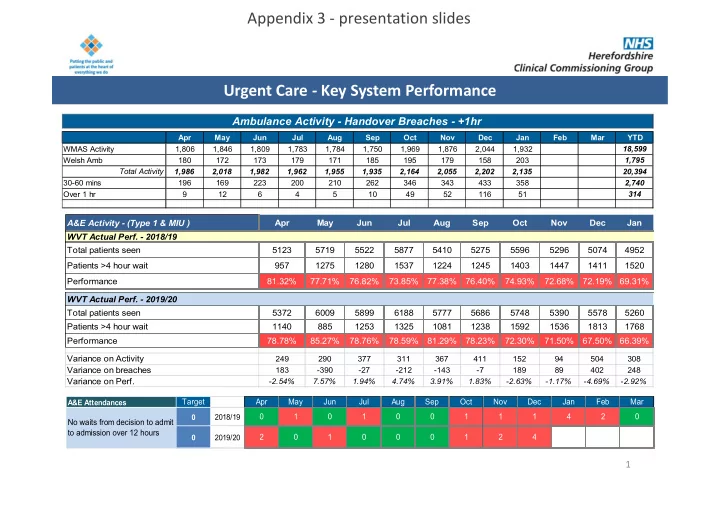
Apr May Jun Jul Aug Sep Oct Nov Dec Jan Feb Mar YTD WMAS Activity 1,806 1,846 1,809 1,783 1,784 1,750 1,969 1,876 2,044 1,932 18,599 Welsh Amb 180 172 173 179 171 185 195 179 158 203 1,795 Total Activity 1,986 2,018 1,982 1,962 1,955 1,935 2,164 2,055 2,202 2,135 20,394 30-60 mins 196 169 223 200 210 262 346 343 433 358 2,740 Over 1 hr 9 12 6 4 5 10 49 52 116 51 314

Ambulance Activity - Handover Breaches - +1hr

A&E Activity - (Type 1 & MIU ) Apr May Jun Jul Aug Sep Oct Nov Dec Jan WVT Actual Perf. - 2018/19 Total patients seen 5123 5719 5522 5877 5410 5275 5596 5296 5074 4952 Patients >4 hour wait 957 1275 1280 1537 1224 1245 1403 1447 1411 1520 Performance 81.32% 77.71% 76.82% 73.85% 77.38% 76.40% 74.93% 72.68% 72.19% 69.31% WVT Actual Perf. - 2019/20 Total patients seen 5372 6009 5899 6188 5777 5686 5748 5390 5578 5260 Patients >4 hour wait 1140 885 1253 1325 1081 1238 1592 1536 1813 1768 Performance 78.78% 85.27% 78.76% 78.59% 81.29% 78.23% 72.30% 71.50% 67.50% 66.39% Variance on Activity

249 290 377 311 367 411 152 94 504 308

Variance on breaches

183

  • 390
  • 27
  • 212
  • 143
  • 7

189 89 402 248

Variance on Perf.

  • 2.54%

7.57% 1.94% 4.74% 3.91% 1.83%

  • 2.63%
  • 1.17%
  • 4.69%
  • 2.92%

A&E Attendances

Target Apr May Jun Jul Aug Sep Oct Nov Dec Jan Feb Mar

2018/19

1 1 1 1 1 4 2

2019/20

2 1 1 2 4 No waits from decision to admit to admission over 12 hours

Appendix 3 - presentation slides

slide-2
SLIDE 2

Urgent Care – Performance Summary

2

A&E System

  • See and convey

(WMAS) for December 2019 was 65.46% against a standard of 55% or less. Ambulance conveyances have significantly increased during the winter period this year than in previous years.

  • January 2020 there was a total of 2,135 ambulance conveyances and 5260 attendances resulting in

performance of 66.39% a performance, a deterioration of -1.11% comparing January with December.

  • There were four 12hr Decision to Admit (DTA) breach in December. YTD there have been 10

breaches.

  • Primary care data shows that A&E attendances per 1,000 population comparing the current year with

the previous year have increased in 8 out of 20 practices. The main increase has been in ambulance arrivals showing a growth of 4.7% and a reduction of 4.5% in walk ins

slide-3
SLIDE 3

Cancer Waiting Times - Key System Performance

3

2WW cancer Wait Apr-19 May-19 Jun-19 Jul-19 Aug-19 Sep-19 Oct-19 Nov-19 Dec-19 Target 93.00% 93.00% 93.00% 93.00% 93.00% 93.00% 93.00% 93.00% 93.00% 2018/19 HCCG Perf 93.67% 90.33% 86.99% 92.58% 86.81% 92.65% 94.48% 94.35% 95.39% 2019/20 HCCG Perf 95.92% 92.33% 92.61% 93.73% 94.74% 97.49% 96.74% 92.99% 91.83% WVT Activity Total Seen 672 626 553 780 615 664 665 709 616 seen within 14 days 646 581 514 735 585 649 644 659 565 Breaches 26 45 39 45 30 15 21 50 51 WVT 2019/20 Actual Perf - HCCG 96.13% 92.81% 92.95% 94.23% 95.12% 97.74% 96.84% 92.95% 91.72% 2WW cancer Wait - Breast Symp. Apr-19 May-19 Jun-19 Jul-19 Aug-19 Sep-19 Oct-19 Nov-19 Dec-19 Target 93.00% 93.00% 93.00% 93.00% 93.00% 93.00% 93.00% 93.00% 93.00% 2018/19 HCCG Perf 83.78% 37.14% 54.55% 63.04% 22.73% 6.45% 19.57% 39.47% 26.32% 2019/20 HCCG Perf 91.07% 94.59% 95.12% 100.00% 80.00% 86.49% 100.00% 96.97% 91.43% WVT Activity Total Seen 53 37 41 36 39 36 35 30 34 seen within 14 days 51 35 39 36 32 32 35 30 31 Breaches 2 2 2 7 4 3 WVT 2019/20 Actual Perf - HCCG 96.23% 94.59% 95.12% 100.00% 82.05% 88.89% 100.00% 100.00% 91.18% 62 day Cancer wait Apr-19 May-19 Jun-19 Jul-19 Aug-19 Sep-19 Oct-19 Nov-19 Dec-19 Target 85.00% 85.00% 85.00% 85.00% 85.00% 85.00% 85.00% 85.00% 85.00% 2018/19 HCCG Perf 73.91% 73.02% 85.25% 86.21% 84.21% 74.00% 71.43% 73.33% 72.92% 2019/20 HCCG Perf 78.38% 71.93% 75.47% 73.33% 72.46% 77.78% 85.37% 71.43% 68.18% WVT Activity Total Seen 48 42 44 44 55 43 31 42 29 seen within 62 days 36.0 35.0 34 35.0 41.5 35.0 27.0 31.5 19.5 Breaches 12.0 7.0 11 9.0 13.5 8.0 4.0 10.5 9.5 WVT 2019/20 Actual Perf - HCCG 75.00% 83.33% 76.14% 79.55% 75.45% 81.40% 87.10% 75.00% 67.24% Glos 2019/20 Actual Perf - HCCG 83.33% 86.67% 62.50% 58.33% 59.09% 66.67% 87.50% 56.25% 73.08%

slide-4
SLIDE 4

Cancer Waits – Performance Summary

4

Cancer Waits

  • 2ww waits – Overall 2ww have generally improved when comparing this year to last.
  • 2ww Breast Symptomatic – 2019/20 has seen a significant in performance when compared to the previous year.

WVT have reviewed and made changes to their internal processes. Additional staff have been recruited to the team which has increased capacity and added stability to a previously fragile service.

  • 62 day waits – Capacity across certain specialties remains an issue. The majority our Hereford patients accessing

treatment at tertiary centres out of county, Gloucester Hospitals for example where patients, on a Urology pathway, are choosing to wait longer than the national measure for robotic treatment.

slide-5
SLIDE 5

RTT Waiting Times - Key System Performance

5

Apr May Jun Jul Aug Sep Oct Nov Dec Target 92.00% 92.00% 92.00% 92.00% 92.00% 92.00% 92.00% 92.00% 92.00% 0-18 wks wait 13,147 13,542 13,655 13,238 13,316 13,650 13,969 13,835 13,717 18+ wks wait 3,022 2,998 2,988 3,054 3,208 3,203 3,167 3,200 3,206 Total 16,169 16,540 16,643 16,292 16,524 16,853 17,136 17,035 16,923 RTT Incomplete Performance 81.31% 81.87% 82.05% 81.25% 80.59% 80.99% 81.52% 81.22% 81.06% Apr May Jun Jul Aug Sep Oct Nov Dec 0-18 wks wait 10,742 11,105 11,282 10,798 10,933 11,131 11,466 11,422 11,288 18+ wks wait 2,601 2,574 2,568 2,653 2,780 2,805 2,780 2,788 2,791 Total 13,343 13,679 13,850 13,451 13,713 13,936 14,246 14,210 14,079 2019/20 WVT Performance 80.51% 81.18% 81.46% 80.28% 79.73% 79.87% 80.49% 80.38% 80.18% Apr May Jun Jul Aug Sep Oct Nov Dec 1 1 4 6 3 3 2 1 2 2 1 Apr May Jun Jul Aug Sep Oct Nov Dec Target 99.00% 99.00% 99.00% 99.00% 99.00% 99.00% 99.00% 99.00% 99.00% Total Waiting List 2650 2694 2893 2598 2475 2988 2889 2821 2530 No.s waiting +6wks 21 24 10 10 11 11 8 9 17 No.s waiting less than 6wks 2629 2670 2883 2588 2464 2977 2881 2812 2513 Performance 99.21% 99.11% 99.65% 99.62% 99.56% 99.63% 99.72% 99.68% 99.33% Total Waiting List 2348 2380 2596 2280 2161 2676 2538 2491 2208 No.s waiting +6wks 5 14 3 3 7 No.s waiting less than 6wks 2343 2366 2593 2280 2158 2676 2538 2491 2201 Performance 99.79% 99.41% 99.88% 100.00% 99.86% 100.00% 100.00% 100.00% 99.68% HCCG Performance WVT Activity - HCCG Commissioned Diagnostic Waits - +6wks - HCCG Diagnostic Waits - +6wks - WVT - HCCG WVT Breaches HCCG Breaches +52wk Breaches

slide-6
SLIDE 6

RTT Waiting Times - Performance Summary

RTT & Diagnostic Waits

  • Diagnostic Waits – WVT have always had minimal waits of greater than 6wks and continue to manage their activity well.
  • RTT Waits +18wks – Pressure remains across the system for patients waiting +18wks. Other avenues of treatment are

being explored as part of the on-going service transformation work.

  • +52wk waits – The majority of +52w breaches are occurring at providers out of county. WVT have made significant

improvement when compared to last year. During the period April 18 to March 19 WVT had 835 breaches. In this current year they have had 5 between April and December.

slide-7
SLIDE 7

Dementia Diagnosis & IAPT - Key System Performance

Dementia Diagnosis

Mar-19 Apr-19 May-19 Jun-19 Jul-19 Aug-19 Sep-19 Oct-19 Nov-19 Dec-19

Performance vs. Estimated Prevalence for 2019/20 Estimated Prevalence 3009 3014 3023 3033 3045 3057 3065 3073 3074 3072 67% of estimated prevalence 2016 2019 2025 2032 2040 2048 2054 2059 2060 2058 Actual 1758 1760 1779 1770 1781 1784 1787 1783 1769 1744 Performance against Est Prev. 58.42% 58.39% 58.85% 58.36% 58.49% 58.36% 58.30% 58.02% 57.55% 56.77% 67.00% 67.00% 67.00% 67.00% 67.00% 67.00% 67.00% 67.00% 67.00% 67.00%

  • 8.58%
  • 8.61%
  • 8.15%
  • 8.64%
  • 8.51%
  • 8.64%
  • 8.70%
  • 8.98%
  • 9.45%
  • 10.23%

IAPT Access Rate Jan-19 Feb-19 Mar-19 Apr-19 May-19 Jun-19 Jul-19 Aug-19 Sep-19 Oct-19 Nov-19 Dec-19 Jan-20 Feb-20 Mar-20 The number of people who have depression and/or anxiety disorders 14520 14520 14520 14520 14520 14520 14520 14520 14520 14520 14520 14520 14520 14520 14520 Target Activity 229 230 231 229 230 231 229 230 231 229 230 231 250 265 285 Quarterly Target 690 690 690 690 800 Target % 4.75% 4.75% 4.75% 4.75% 5.51% Annualised target 19.01% 19.01% 19.01% 19.01% 22.04% Actual Activity - Monthly 185 173 158 199 199 166 193 196 193 240 227 203 Actual Activity - Rolling Quarter (Last 3 months) 185 358 516 530 556 564 558 555 582 629 660 670 430 203 Access rate achieved - Rolling Quarter (Last 3 months) 1.27% 2.47% 3.55% 3.65% 3.83% 3.88% 3.84% 3.82% 4.01% 4.33% 4.55% 4.61% 2.96% 1.40% 0.00% Annualised Rate progress based on Rolling Quarter x by 4 5.10% 9.86% 14.21% 14.60% 15.32% 15.54% 15.37% 15.29% 16.03% 17.33% 18.18% 18.46% 11.85% 5.59% 0.00%

IAPT Recovery

The number of people who have completed treatment (minimum 2 treatment contacts). 107 147 119 147 171 158 185 146 186 178 169 128 The number of people who are “moving to recovery” (of those who have completed treatment). 62 75 67 76 88 79 90 79 100 91 86 66 IAPT Recovery Rate 57.94% 51.02% 56.30% 51.70% 51.46% 50.00% 48.65% 54.11% 53.76% 51.12% 50.89% 51.56% #DIV/0! #DIV/0! #DIV/0! IAPT Recovery Rate - Rolling Quarter perf. 53.72% 52.03% 54.69% 52.78% 52.26% 50.52% 49.52% 50.72% 52.03% 52.94% 51.97% 51.16% Q4 Q1 Q2 Q3 Q4

slide-8
SLIDE 8

Dementia Diagnosis & IAPT - Performance Summary

Dementia Diagnosis & IAPT

  • Dementia Diagnosis Rate – We have recovery plans in place and are constantly working with primary care and our MH

provider to ensure we are identifying or monitoring people earlier with a dementia diagnosis. Our performance against the national standard mirrors that of similar rural counties. In terms of our dementia registered patients we see for every 10 patients newly diagnosed approximately 30 die or move out of county to be closer to family support.

  • IAPT Access – Achieving the

access standard has always been challenging. This year has seen an improvement towards the standard of 22%. The provider, 2gether NHSFT, have taken on new staff as part of a national training programme and they have also amended their service provision which is now showing the improvement. This has also increased their capacity to see more patients.

  • IAPT Recovery – Continues to perform above the expected standard.
  • IAPT Waiting Times – 6 & 18wk – Both waiting time standards continue to perform well in excess of the expected

standard