upstream priority
play

Upstream Priority: the role of social determinants in promoting - PDF document

1/31/2020 Upstream Priority: the role of social determinants in promoting health Greg Moody, Executive in Residence moody.67@osu.edu February 3, 2020 JOHN GLENN COLLEGE OF PUBLIC AFFAIRS Life expectancy in years Health Spending vs. Life


  1. 1/31/2020 Upstream Priority: the role of social determinants in promoting health Greg Moody, Executive in Residence moody.67@osu.edu February 3, 2020 JOHN GLENN COLLEGE OF PUBLIC AFFAIRS Life expectancy in years Health Spending vs. Life Expectancy • The U.S spends more on health care than any other country while achieving some of the worst population health outcomes. • A common hypothesis: high U.S. health care spending results from low spending on social programs, based on evidence that low social spending leads to a sicker population and higher health care costs. Annual per capita health expenditure (measured in 2010 international dollars) 
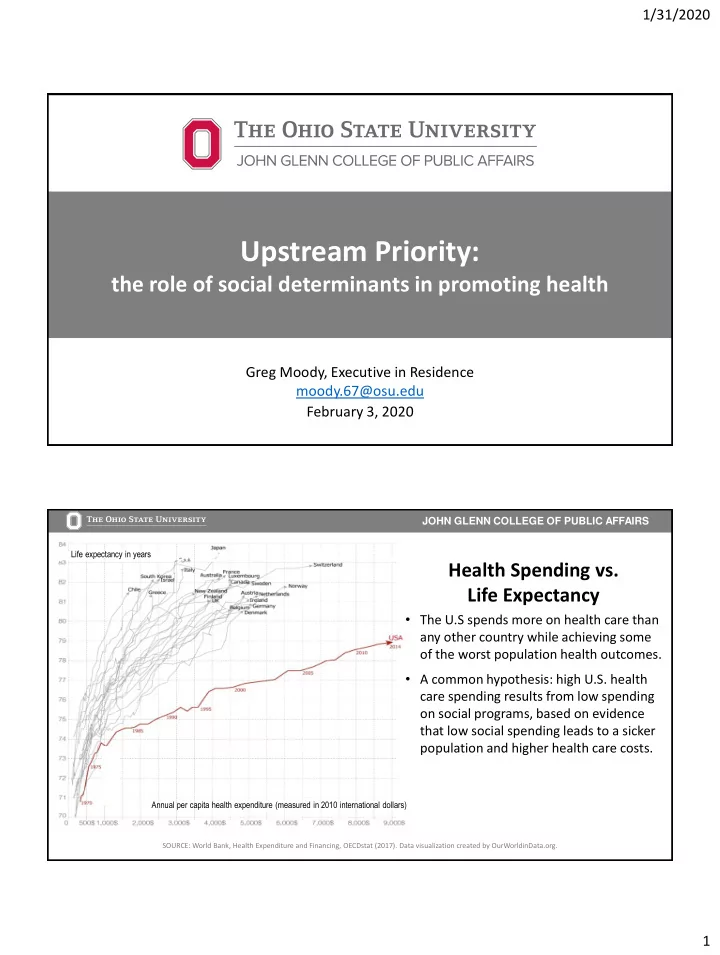
SOURCE: World Bank, Health Expenditure and Financing, OECDstat (2017). Data visualization created by OurWorldinData.org. 1

  2. 1/31/2020 JOHN GLENN COLLEGE OF PUBLIC AFFAIRS . Health Spending vs. Health care spending as United States a percentage of GDP Social Spending • U.S. social spending (19.7% of GDP) is slightly above the average for high- income countries (17.7% of GDP) • Countries that spend more on health also tend to spend more on social spending (health spending does not appear to crowd out social spending). • Countries with the greatest increases in health spending over time also had larger increases in social spending. Social spending as a percentage of GDP SOURCE: Papanicolas, Woskie, Orlander, Orav and Jha, The Relationship Between Health Spending and Social Spending in High-Income Countries , Health Affairs (August 14, 2019). Analysis of data from the OECD Social Expenditure Database (SOCX). Education spending is included; health-related social spending is excluded. JOHN GLENN COLLEGE OF PUBLIC AFFAIRS How we spend is as important as how much • What determines health outcomes? • How do social conditions impact health? • Are social needs the same as social determinants? • What social spending has the biggest impact on health? • How can we get the most from the money we spend? 2

  3. 1/31/2020 JOHN GLENN COLLEGE OF PUBLIC AFFAIRS Most “health” is not determined by clinical medicine Social and Economic Genes and Biology 40% • 10% Education • Employment/Income • Racism/Discrimination Clinical Care 10% • Access • Quality • Health Behaviors Care Coordination 30% 10% • Physical activity • Physical Environment Nutrition/Food • Substance use • Housing • Transportation • Parks SOURCE: Determinants of Health Model based on frameworks developed by: Tarlov AR. Ann N Y Acad Sci 1999; 896: 281-93; and Kindig D, Asada Y, Booske B. JAMA 2008; 299(17): 2081-2083. JOHN GLENN COLLEGE OF PUBLIC AFFAIRS • The social determinants of health are the conditions in which people are born, grow, live, work and age. • These circumstances are shaped by the distribution of money, power and resources at global, national and local levels. • The social determinants of health are mostly responsible for health inequities – the unfair and avoidable differences in health status seen within and between countries. SOURCE: World Health Organization Commission on the Social Determinants of Health (2008). 3

  4. 1/31/2020 JOHN GLENN COLLEGE OF PUBLIC AFFAIRS W here we are born, grow, live, work and age … Communities of Opportunity Low-Opportunity Communities • Social and economic inclusion • Social and economic exclusion Good • Thriving small businesses • Few small businesses Health • Grocery stores • Fast food restaurants Status • Parks and trails • Unsafe or limited parks • Sufficient healthy housing • Poor and limited housing stock Poor • Home ownership • Rental housing/foreclosure Health • Good transportation options • Few transportation options Status • Financial institutions • Payday lenders • Better performing schools • Poor performing schools • Strong local governance • Weak local governance SOURCE: Ehlinger, Edward, MD, Advancing Health and Health Equity: Integrating Medical Care and Public Health (October 2017). JOHN GLENN COLLEGE OF PUBLIC AFFAIRS 62.5 63.2 Life Expectancy in Ohio 88.6 • 77.5 years on average in Ohio 89.2 compared to 78.6 nationally 61.6 87.3 • Where you live influences 87.3 how long you live 60.0 61.1 • 29-year range from 60.0 in 87.6 63.5 Franklinton to 89.2 in Stow 63.3 87.4 88.2 SOURCE: National Center for Health Statistics. U.S. Small-Area Life Expectancy Estimates Project (USALEEP): Life Expectancy Files for Ohio, 2010-2015. 4

  5. 1/31/2020 JOHN GLENN COLLEGE OF PUBLIC AFFAIRS 87.6 Central 85.2 Life Expectancy in Ohio 85.8 V • 77.6 years in Franklin County compared to 77.5 statewide 65.0 • 27.6-year gap from Dublin to Franklinton; 18.3-year gap 84.5 67.1 85.4 Near East one mile to Bexley 65.2 • The social and economic conditions where you live 60.0 influence how long you live 64.4 SOURCE: National Center for Health Statistics. U.S. Small-Area Life Expectancy Estimates Project (USALEEP): Life Expectancy Files for Ohio, 2010-2015. JOHN GLENN COLLEGE OF PUBLIC AFFAIRS • Social determinants of health may impact any downstream health outcome – heart disease, cancer, injury, stroke, diabetes, pneumonia, kidney disease … • They drive the three lethal epidemics that reduced U.S. life expectancy three years in a row (2015-2017) – suicide, drug overdose, and alcoholism • Social determinants are mostly responsible for unfair differences in health status across populations – for example, disparities in infant mortality 5

  6. 1/31/2020 JOHN GLENN COLLEGE OF PUBLIC AFFAIRS Address social determinants of health • Improve community conditions for all • Laws, policies, and regulations • Whole population • Focus on assets Address individual social needs • Link individuals to services and supports • Community-based organizations • At-risk groups • Focus on deficits React to downstream consequences • Treat individual, acute conditions • Clinical medicine • Specific patient • Focus on the crisis JOHN GLENN COLLEGE OF PUBLIC AFFAIRS Downstream Consequence: Ohio suicide deaths increased 45 percent in 10 years • Ohio is part of a national trend – the U.S. rate is highest in 50 years • 1,836 Ohioans committed suicide in 2018 compared to 1,268 in 2007 • Suicide rates increased 64 percent for Ohio youth aged 10-24 years and 48 percent for Ohioans aged 60 or older (2007-2018) • Nine of Ohio’s 10 counties with the highest suicide rates are in economically distressed Appalachian communities. • Firearms accounted for half (52 percent) of Ohio’s suicide fatalities. SOURCE: Ohio Department of Health, Suicide Demographics and Trends in Ohio (2018). 6

  7. 1/31/2020 JOHN GLENN COLLEGE OF PUBLIC AFFAIRS SUICIDE • Raising the minimum wage $1 reduces suicides 3.4-5.9 percent on average* • School-based awareness and education • Gun locks and safe storage • Standardized screening and referral • Trauma-informed health care • Case management for individual high risk • Crisis intervention and treatment SOURCE: Ohio Department of Health, State Health Improvement Plan (2017-2019). *Kaufman, Salas-Hernandez, Komro, Livingston. Effects of increased minimum wages by unemployment rate on suicide in the USA, Journal of Epidemiology and Community Health (November 2019). JOHN GLENN COLLEGE OF PUBLIC AFFAIRS Downstream Consequence: Ohio’s drug overdose death rate is twice the national average OH = 46.3 US = 21.7 SOURCE: Ohio Department of Health, 2017 Ohio Drug Overdose Data (September 2018) and Kaiser Family Foundation analysis of CDC National Center for Health Statistics (January 2019). 7

  8. 1/31/2020 JOHN GLENN COLLEGE OF PUBLIC AFFAIRS DRUG OVERDOSE DEATHS • Community awareness and education • Cut off illegal supply • Prescriber guidelines • Medicaid expansion coverage • Drug courts • Recovery housing • Medication-Assisted Treatment (MAT) • Access to providers • Naloxone (Narcan) at the source SOURCE: Ohio Department of Health, State Health Improvement Plan (2017-2019). JOHN GLENN COLLEGE OF PUBLIC AFFAIRS Ohio infant deaths in 2017 second-lowest on record 1,400 1,225 1,167 1,163 1,143 1,200 1,109 1,086 1,064 1,047 1,024 1,024 1,005 982 955 1,000 Number of deaths 800 600 400 200 0 2005 2006 2007 2008 2009 2010 2011 2012 2013 2014 2015 2016 2017 SOURCE: Ohio Department of Health, 2017 Ohio Infant Mortality Data: General Findings (December 2018). 8

  9. 1/31/2020 JOHN GLENN COLLEGE OF PUBLIC AFFAIRS Downstream Consequence: Black infants in Ohio die at nearly 3X the rate of white infants 1,400 1,225 1,167 1,163 1,143 1,200 1,109 1,086 1,064 1,047 1,024 1,024 1,005 Overall = 7.2 982 955 1,000 deaths per 1,000 Number of deaths 809 769 738 738 800 713 687 672 675 641 610 580 White = 5.3 568 550 600 deaths per 1,000 425 424 408 384 384 371 362 363 367 369 Black = 15.6 344 330 338 400 deaths per 1,000 200 0 2005 2006 2007 2008 2009 2010 2011 2012 2013 2014 2015 2016 2017 SOURCE: Ohio Department of Health, 2017 Ohio Infant Mortality Data: General Findings (December 2018). JOHN GLENN COLLEGE OF PUBLIC AFFAIRS INFANT MORTALITY • Comprehensive primary care • Safe sleep awareness • Smoke-free environments • Links to smoking cessation support • Services to support healthy birth spacing • Community health worker referrals • Intensive care coordination for high risk • Progesterone treatment SOURCE: Ohio Department of Health, State Health Improvement Plan (2017-2019). 9

Download Presentation
Download Policy: The content available on the website is offered to you 'AS IS' for your personal information and use only. It cannot be commercialized, licensed, or distributed on other websites without prior consent from the author. To download a presentation, simply click this link. If you encounter any difficulties during the download process, it's possible that the publisher has removed the file from their server.

Recommend


More recommend