
SLIDE 1
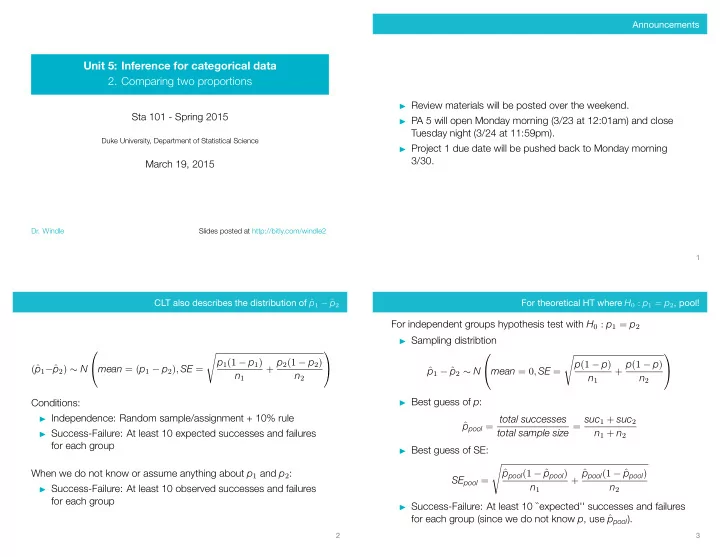
Unit 5: Inference for categorical data
- 2. Comparing two proportions
Sta 101 - Spring 2015
Duke University, Department of Statistical Science
March 19, 2015
- Dr. Windle