
SLIDE 1
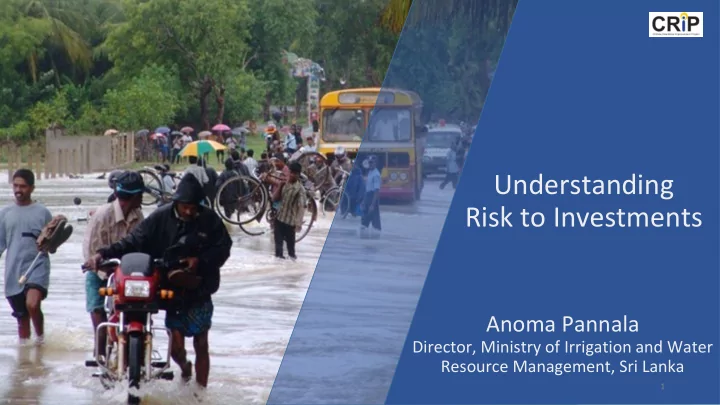
Understanding Risk to Investments
Anoma Pannala
Director, Ministry of Irrigation and Water Resource Management, Sri Lanka
1
Understanding Risk to Investments Anoma Pannala Director, Ministry - - PowerPoint PPT Presentation
Understanding Risk to Investments Anoma Pannala Director, Ministry of Irrigation and Water Resource Management, Sri Lanka 1 87% of Sri Lankan population lives in hotspots 2 Recurrent climate-induced disasters pressure national economy
1
2
3
4
5
6 Mundeni Aru
7
8
9
Event Analysis: Flow and rainfall
Hourly Rainfall (mm) Observed Flow (m3/s) Flow (m3/s) - Natural SWAT model Flow (m3/s) - Natural SWAT model with major reservoirs 10
12