
SLIDE 1
Understanding data & statistical terminology
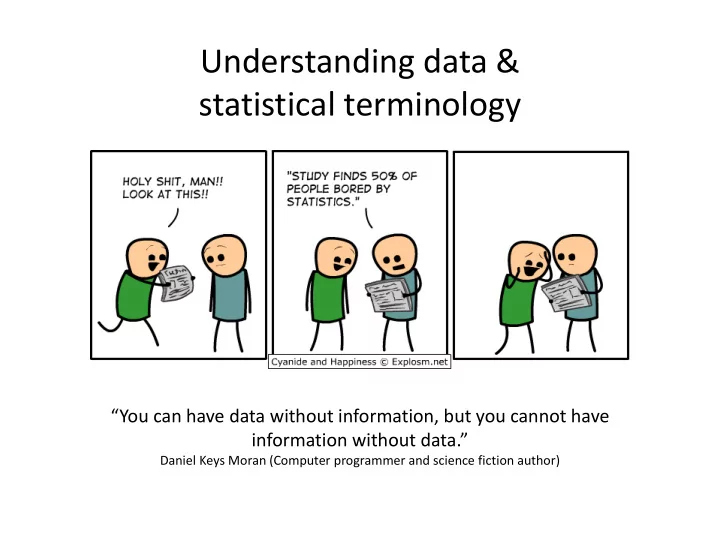
“You can have data without information, but you cannot have information without data.”
Daniel Keys Moran (Computer programmer and science fiction author)
Understanding data & statistical terminology You can have data - - PowerPoint PPT Presentation
Understanding data & statistical terminology You can have data without information, but you cannot have information without data. Daniel Keys Moran (Computer programmer and science fiction author) Trembling aspen ( Populus tremuloides
“You can have data without information, but you cannot have information without data.”
Daniel Keys Moran (Computer programmer and science fiction author)
(Populus tremuloides)
Western North America distribution
Aspen frequency
% Forest Cover
Central location of aspen population
n=100 samples take at each
(Populus tremuloides)
Western North America distribution
Central location of aspen population
n=100 samples take at each
Can the data we collect in AB realistically be used to make inferences about Aspen in Colorado? So what is our population?
Aspen frequency
% Forest Cover
(Populus tremuloides)
Western North America distribution
Central location of aspen population
n=100 samples take at each
What if all the samples came from northern mixedwood ecosystems north of High Level, AB? What can we realistically make inferences about?
High Level
Aspen frequency
% Forest Cover
Farm 1 Farm 2
Plot
1 Variety in each
Individual lentil plants
A A A A A A A B B B B B A B C C C C C C C C Do yield of different lentil varieties differ at 2 farms? Do the varieties differ among themselves?
Forest stand Transect Animal tracks
Is there a difference in the use of forest corridors in different stand types by ungulates?
Conifer dominated Deciduous dominated
(inferences) about the population from which the sample was taken
characteristic (e.g. population mean)
associated with each possible value of a variable
value