u i u i i i 1 n 1 k k 1 k k 1 1 k to estimate the
play

u i u i , i i (1) N 1 k k 1 K k 1 1 K To - PDF document

Transactions of the Korean Nuclear Society Virtual Spring Meeting July 9-10, 2020 Implementation of Cross Section Random Sampling Code System for Direct Sampling Method in Continuous Energy Monte Carlo Calculations Ho Jin Park a , Tae Young


  1. Transactions of the Korean Nuclear Society Virtual Spring Meeting July 9-10, 2020 Implementation of Cross Section Random Sampling Code System for Direct Sampling Method in Continuous Energy Monte Carlo Calculations Ho Jin Park a  , Tae Young Han a , Jin Young Cho a a Korea Atomic Energy Research Institute, 111, Daedeok-daero 989beon-gil, Daejeon, 34057, Korea * Corresponding author: parkhj@kaeri.re.kr where B T is the transpose matrix of B . Then, if C u is 1. Introduction symmetrical and positive definite, one can obtain a sample set by: In the conventional nuclear reactor development, the uncertainty of the nuclear core design and analysis code i    is evaluated and provided by comparing calculated X X B Z (4) values with measured. Generally, this uncertainty is calculated under conservative conditions. Recently, the where X is the mean vector defined by the mean Best Estimate Plus Uncertainty (BEPU) method has values from Eq. (1), and Z is a random normal vector been widely investigated and utilized for the uncertainty calculated directly from a random sampling of the quantification (UQ). In the BEPU method, the standard normal distribution using the Box-Muller uncertainty provides a combination of the best-estimate method. models under realistic conditions. The best estimate 1 st input set 1 st output results are calculated by the average values and their Code uncertainties, which can be calculated by the Q uncertainties from various inputs. (1) u 1 1 There are two approaches for the uncertainty analysis Sampled Input Set   in the BEPU method. One is the Sensitivity/Uncertainty i -th output i -th input set (S/U) analysis method [1] based on the perturbation techniques and the other is the Direct Sampling Method Q (DSM) [2,3] by random samplings (RS) of input i ( ) i u parameters according to their covariance data. 1   In this study, we developed the McCARD/MIG [4] cross section RS code system for DSM in continuous Q energy MC calculations. This code system was applied u ( N ) N to the Godiva and TMI-1 PWR pin problem for UQ 1 analysis. 
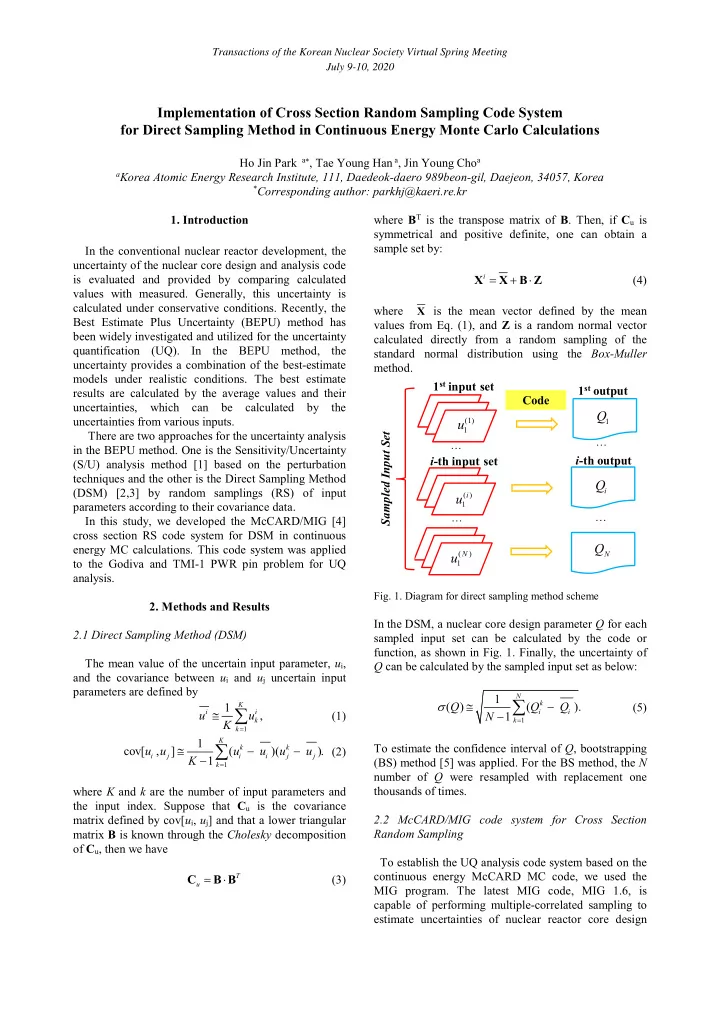
Fig. 1. Diagram for direct sampling method scheme 2. Methods and Results In the DSM, a nuclear core design parameter Q for each 2.1 Direct Sampling Method (DSM) sampled input set can be calculated by the code or function, as shown in Fig. 1. Finally, the uncertainty of The mean value of the uncertain input parameter, u i , Q can be calculated by the sampled input set as below: and the covariance between u i and u j uncertain input parameters are defined by 1 N     k  ( ) Q ( Q Q ). 1 K (5)   u i u i , i i (1) N 1  k k 1 K  k 1 1 K   To estimate the confidence interval of Q , bootstrapping  k  k  cov[ u u , ] ( u u )( u u ). (2) i j i i j j K 1 (BS) method [5] was applied. For the BS method, the N k  1 number of Q were resampled with replacement one where K and k are the number of input parameters and thousands of times. the input index. Suppose that C u is the covariance matrix defined by cov[ u i , u j ] and that a lower triangular 2.2 McCARD/MIG code system for Cross Section Random Sampling matrix B is known through the Cholesky decomposition of C u , then we have To establish the UQ analysis code system based on the continuous energy McCARD MC code, we used the u   T C B B (3) MIG program. The latest MIG code, MIG 1.6, is capable of performing multiple-correlated sampling to estimate uncertainties of nuclear reactor core design

  2. Transactions of the Korean Nuclear Society Virtual Spring Meeting July 9-10, 2020 parameters by means of the DSM. Figure 2 shows the 1 2 3 4 5 6 7 8 9 10 11 12 13 14 15 16 17 18 19 20 21 22 23 24 25 26 27 28 29 30 1 flowchart of the McCARD/MIG UQ analysis code 2 3 system by cross section RS. Using the raw covariance 4 5 6 matrix, MIG produces the cross section ratio input sets 7 8 by random multiple-correlated sampling. Using the 9 10 sampled cross section input sets, McCARD performs 11 12 13 direct sampling core calculations. 14 15 16 17 18 Raw Covariance Matrix MIG input for SAMPXS 19 20 21 22 23 24 MIG 25 26 27 28 MIG batch file 29 30 Generated Continuous energy McCARD input SAMPXS dat file Library Fig. 4. Correlation coefficient matrix of 235 U v (mt452) from 100 random samples by MIG McCARD mt 102 MC Outputs for each sampled XS mt 2 PrintTally2 Uncertainties Fig. 2. Flowchart of McCARD/MIG UQ analysis code system by cross section random sampling Figures 3 and 4 show the correlation coefficient matrix of 235 U v (mt452) from raw cross section covariance data and 100 random samples by MIG. The raw cross section covariance matrix was generated by the NJOY code using the ENDF/B-VII.1 evaluated nuclear data library. The LANL 30 energy group structure was used. mt 4 Figures 5 and 6 show the correlation coefficient matrix of 235 U considering three different cross section types Fig. 5. Correlation coefficient matrix of 235 U considering three cross section types from raw cross section covariance data (capture, elastic and inelastic scattering). Overall, the correlation coefficients sampled by MIG agree well with those from the raw cross section covariance. 1 2 3 4 5 6 7 8 9 10 11 12 13 14 15 16 17 18 19 20 21 22 23 24 25 26 27 28 29 30 1 2 3 4 5 6 7 8 9 10 11 12 13 14 15 16 17 18 19 20 21 22 23 24 25 26 27 28 29 30 Fig. 6. Correlation coefficient matrix of 235 U including three Fig. 3. Correlation coefficient matrix of 235 U v (mt452) from cross section types from 100 random samples by MIG raw cross section covariance data

  3. Transactions of the Korean Nuclear Society Virtual Spring Meeting July 9-10, 2020 2.3 Uncertainty Quantification in k for Godiva and TMI-1 PWR pin problem Table I: Uncertainties in k eff for the Godiva Uncertainties (%) in k eff Tables I and II provide a comparison of the (ENDF/B-VII.1) XS Type for uncertainties by the S/U analysis by the McCARD MC Nuclide Covariance DSM ※ perturbation modules and DSM analysis by the S/U (100 samples) McCARD/MIG UQ analysis code system for the Godiva and TMI-1 PWR pin problem [6]. As the ν, ν 0.543 0.544 covariance data of the cross section, the ENDF/B-VII.1 (n,γ), (n,γ) 0.876 0.866 data for 235 U and 238 U were used on the assumption that 235 U (n,f), (n,f) 0.266 0.257 only these two major actinides have cross-section (n,n), (n,n) 0.286 0.282 uncertainties. In these calculations, we considered the (n,n’), (n,n’) 0.565 0.596 correlations between (n,γ), elastic scattering, inelastic ν, ν 0.011 0.025 scattering cross sections, and independently sampled the (n,γ), (n,γ) 0.001 0.023 cross sections for the other reaction types (i.e. v and fission). For the DSM, 100 MC runs were conducted for 238 U (n,f), (n,f) 0.003 0.023 each case. For the Godiva and TMI-1 pin problem, the (n,n), (n,n) 0.028 0.034 statistical uncertainty in k for a single MC calculation (n,n’), (n,n’) 0.070 0.079 was less than 0.02% and 0.03%, respectively. The Total 1.194 1.214 ± 0.086 results by S/U method were taken from the reference ※ The statistical uncertainty for each k eff in DSM is less than 0.02% [6,7]. Table II: Uncertainties in k inf for the TMI-1 pin problem Godiva (ENDF/B-VII.1) 1.2 DSM Uncertainties (%) in k inf S/U XS Type for (ENDF/B-VII.1) Uncertainties in keff (%) 1.0 Nuclide Covariance DSM ※ S/U (100 samples) 0.8 ν, ν 0.602 0.606 0.6 (n,γ), (n,γ) 0.208 0.216 235 U (n,f), (n,f) 0.079 0.084 0.4 (n,n), (n,n) 0.002 0.014 0.2 (n,n’), (n,n’) 0.004 0.018 ν, ν 0.073 0.064 0.0 U235 ν U235 (n,γ) U235 (n,f) U235 (n,n) U235 (n,n') U238 v U238 (n,γ) U238 (n,f) U238 (n,n) U238 (n,n') Total (n,γ), (n,γ) 0.295 0.296 238 U (n,f), (n,f) 0.016 0.025 Fig. 7. Comparison between the uncertainties in k eff by DSM (n,n), (n,n) 0.034 0.022 and by S/U UQ analysis for the Godiva (n,n’), (n,n’) 0.090 0.108 Total 0.720 0.733±0.071 ※ The statistical uncertainty for each k eff in DSM is less than 0.03% 0.8 TMI-1 PWR Pin (ENDF/B-VII.1) The confidence intervals of the total uncertainties were 0.7 DSM calculated by the BS method using 1,000 repeated Uncertainties in kinf (%) 0.6 S/U samplings. The uncertainties in k by the S/U and DSM analysis were in good agreement as shown in Figs. 7 0.5 and 8. 0.4 3. Conclusions 0.3 0.2 In this study, we successfully implemented the cross section RS modules for the DSM in continuous energy 0.1 Monte Carlo Calculations into the McCARD and MIG 0.0 v1.6 codes, and established the McCARD/MIG UQ U235 ν U235 (n,γ) U235 (n,f) U235 (n,n) U235 (n,n') U238 v U238 (n,γ) U238 (n,f) U238 (n,n) U238 (n,n') Total analysis code system for the DSM. From the UQ results for Godiva and TMI-1 PWR pin problem, the results by Fig. 8. Comparison between the uncertainties in k inf by DSM the DSM agreed well with those by the S/U method and and by S/U UQ analysis for the TMI-1 pin problem confirmed that this code system works well.

Download Presentation
Download Policy: The content available on the website is offered to you 'AS IS' for your personal information and use only. It cannot be commercialized, licensed, or distributed on other websites without prior consent from the author. To download a presentation, simply click this link. If you encounter any difficulties during the download process, it's possible that the publisher has removed the file from their server.

Recommend


More recommend