
SLIDE 1
U 4: I L 2: t- S 104
Nicole Dalzell June 2, 2015
Announcements Example: Friday the 13th
Friday the 13th
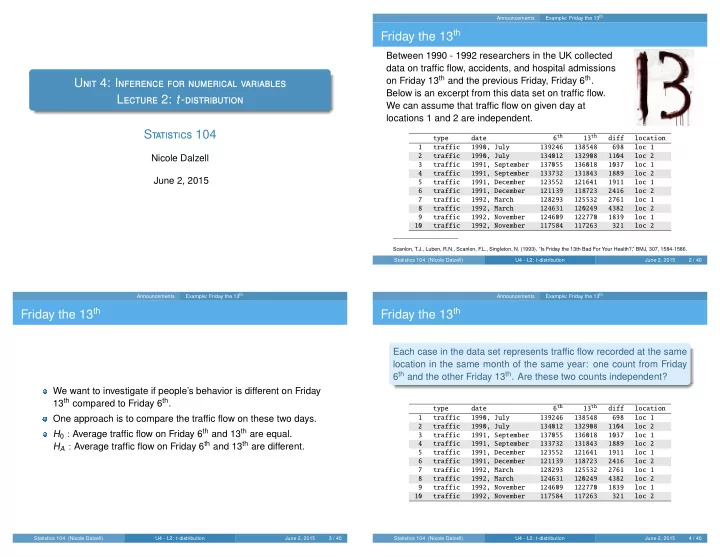
Between 1990 - 1992 researchers in the UK collected data on traffic flow, accidents, and hospital admissions
- n Friday 13th and the previous Friday, Friday 6th.
Below is an excerpt from this data set on traffic flow. We can assume that traffic flow on given day at locations 1 and 2 are independent.
type date 6th 13th diff location 1 traffic 1990, July 139246 138548 698 loc 1 2 traffic 1990, July 134012 132908 1104 loc 2 3 traffic 1991, September 137055 136018 1037 loc 1 4 traffic 1991, September 133732 131843 1889 loc 2 5 traffic 1991, December 123552 121641 1911 loc 1 6 traffic 1991, December 121139 118723 2416 loc 2 7 traffic 1992, March 128293 125532 2761 loc 1 8 traffic 1992, March 124631 120249 4382 loc 2 9 traffic 1992, November 124609 122770 1839 loc 1 10 traffic 1992, November 117584 117263 321 loc 2
Scanlon, T.J., Luben, R.N., Scanlon, F .L., Singleton, N. (1993), “Is Friday the 13th Bad For Your Health?,” BMJ, 307, 1584-1586. Statistics 104 (Nicole Dalzell) U4 - L2: t-distribution June 2, 2015 2 / 40 Announcements Example: Friday the 13th
Friday the 13th
We want to investigate if people’s behavior is different on Friday 13th compared to Friday 6th. One approach is to compare the traffic flow on these two days. H0 : Average traffic flow on Friday 6th and 13th are equal. HA : Average traffic flow on Friday 6th and 13th are different.
Statistics 104 (Nicole Dalzell) U4 - L2: t-distribution June 2, 2015 3 / 40 Announcements Example: Friday the 13th
Friday the 13th
Each case in the data set represents traffic flow recorded at the same location in the same month of the same year: one count from Friday 6th and the other Friday 13th. Are these two counts independent?
type date 6th 13th diff location 1 traffic 1990, July 139246 138548 698 loc 1 2 traffic 1990, July 134012 132908 1104 loc 2 3 traffic 1991, September 137055 136018 1037 loc 1 4 traffic 1991, September 133732 131843 1889 loc 2 5 traffic 1991, December 123552 121641 1911 loc 1 6 traffic 1991, December 121139 118723 2416 loc 2 7 traffic 1992, March 128293 125532 2761 loc 1 8 traffic 1992, March 124631 120249 4382 loc 2 9 traffic 1992, November 124609 122770 1839 loc 1 10 traffic 1992, November 117584 117263 321 loc 2
Statistics 104 (Nicole Dalzell) U4 - L2: t-distribution June 2, 2015 4 / 40