
SLIDE 1
Draft 10/8/2010
1
Turning the Tide on Outages1
What are the true costs of implementing — or failing to implement — a stronger, smarter and more robust grid
In a month during which the nation observed the 7th anniversary of the August 2003 Blackout (over 50 million consumers affected and more than $6 billions in losses), the 5th anniversary of Hurricane Katrina (more than 1800 deaths and over $150 billion in economic losses), and the August 1, 2007 collapse of the I‐35W bridge in Minneapolis (killing 13 and disrupting traffic and the local economy for a year), in addition to the hundreds of black‐outs, water main breaks and daily traffic gridlocks, have stimulated growing public awareness of the necessity for accelerated programs of replacement, rehabilitation and new investment in the U.S. infrastructure2. Focusing on the electric power sector, the power outages and power quality disturbances cost the U.S. economy
- ver $80 billion annually, and up to $188 billion per year. Transmission and distribution losses in the U.S. were
about 5% in 1970, and grew to 9.5% in 2001, due to heavier utilization and more frequent congestion. Regarding the former, starting in 1995, the amortization/ depreciation rate exceeded utility construction expenditures. Since that crossover point in 1995, utility construction expenditures have lagged behind asset depreciation. This has resulted in a mode of operation of the system that is analogous to harvesting more rapidly than planting replacement seeds. As a result of these diminished “shock absorbers,” the electric grid is becoming increasingly stressed, and whether the carrying capacity or safety margin will exist to support anticipated demand is in question. To assess impacts using actual electric power outage data for the U.S., which are generally available from several sources, including from the U.S. DOE’s Energy Information Administration (EIA) and the from the North American Electric Reliability Corporation (NERC). In general, the EIA database contains more events, and the NERC database gives more information about the events. Both databases are extremely valuable sources of information and
- insight. In both databases, a report of a single event may be missing certain data elements such as the amount of
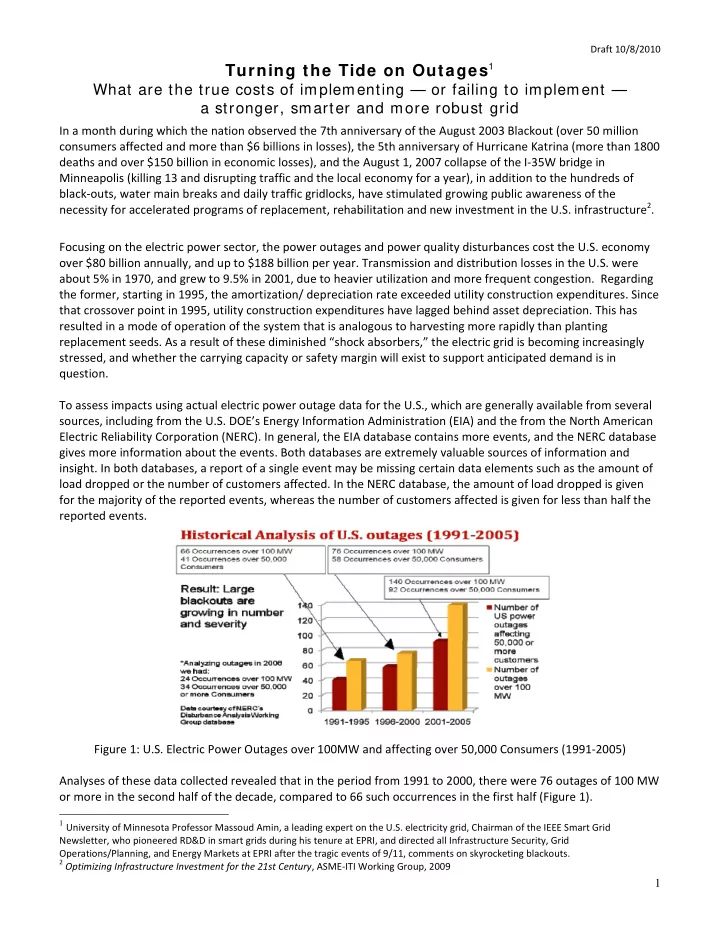
load dropped or the number of customers affected. In the NERC database, the amount of load dropped is given for the majority of the reported events, whereas the number of customers affected is given for less than half the reported events. Figure 1: U.S. Electric Power Outages over 100MW and affecting over 50,000 Consumers (1991‐2005) Analyses of these data collected revealed that in the period from 1991 to 2000, there were 76 outages of 100 MW
- r more in the second half of the decade, compared to 66 such occurrences in the first half (Figure 1).
1 University of Minnesota Professor Massoud Amin, a leading expert on the U.S. electricity grid, Chairman of the IEEE Smart Grid
Newsletter, who pioneered RD&D in smart grids during his tenure at EPRI, and directed all Infrastructure Security, Grid Operations/Planning, and Energy Markets at EPRI after the tragic events of 9/11, comments on skyrocketing blackouts.
2 Optimizing Infrastructure Investment for the 21st Century, ASME‐ITI Working Group, 2009