trowbridge traffic counts 2017 post hrr opening
play

TROWBRIDGE TRAFFIC COUNTS 2017 POST HRR OPENING Sustainable - PowerPoint PPT Presentation

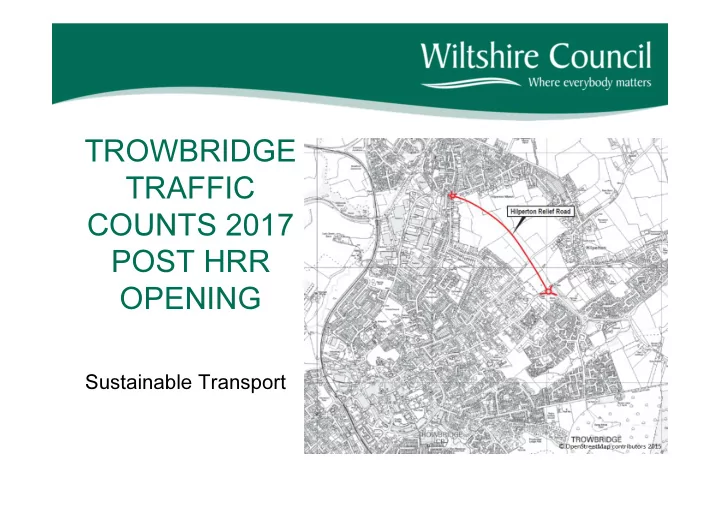
TROWBRIDGE TRAFFIC COUNTS 2017 POST HRR OPENING Sustainable Transport Overview HRR Objectives Traffic Counts before and after Traffic count limitations Traffic trends post opening Speed data Summary Questions HRR Objectives


  1. TROWBRIDGE TRAFFIC COUNTS 2017 POST HRR OPENING Sustainable Transport

  2. Overview HRR Objectives Traffic Counts – before and after Traffic count limitations Traffic trends post opening Speed data Summary Questions

  3. HRR Objectives Primary Objective • Reduce level of traffic through Hilperton, particularly HGVs Secondary Objective • Support traffic routing strategy for Trowbridge

  4. Traffic Counts – Before 2009 AM and PM Turning Counts Light Goods Vehicles Heavy Goods Vehicles

  5. Traffic Counts March 17 Comparison data includes – Hilperton – HRR – Leap Gate – Southwick – Holt Data collected – Flows – Speeds – Vehicle type

  6. Traffic Count Limitations • Before – Peak hour only – 2009 – Single day – Appropriate growth factor (3% used) • After – 2017 – One week – Dynamic Trowbridge

  7. Advisory Routes 2009

  8. Weight Limits

  9. RESUTLS Primary Objective: Reduce level of traffic through Hilperton, particularly HGVs Marsh Road (at Hammond Way) changes from 2009: • LGV reduced from 929 to 537 • HGV reduced from 34 to 4 (now HGV restriction applies) • 89% reduction HGV

  10. Secondary Objective –Support Traffic routing strategy for Trowbridge

  11. The Down Changes from 2009: • No change in LGV • 81% reduction HGV

  12. Seymour Road Changes from 2009: • 19% increase in LGV • 62% reduction HGV

  13. Staverton • Staverton • HGVs reduced by 53% • LGVs reduced by 5%

  14. Holt (2013 - 12 hr count) • HGVs reduced by 22% • LGVs reduced by 21%

  15. Hilperton Road • HGVs reduced by 76% • LGVs reduced by 11%

  16. Hilperton Drive (Leap Gate Roundabout) Hilperton Drive (North of Junction) • HGVs reduced by 55% • LGVs increased by 16% Hilperton Drive (South of Junction) • HGVs reduced by 50% • LGVs increased by 6%

  17. West Ashton Rod (south and north of Leapgate) West Ashton Road (North of Junction) • HGVs reduced by 39% • LGVs increased by 60% West Ashton Road (South of Junction) • HGVs increased by 3% • LGVs increased by 28%

  18. Wynsome Street • HGVs reduced by 11% (from 68 to 62) • LGVs increased by 2%

  19. HRR (Elizabeth Way) HRR 2017 Count • LGV = 2139 • HGV = 32

  20. Leap Gate 2017 Leap Gate A • LGV = 1,742 • HGV = 13 Leap Gate B • LGV = 1,792 • HGV = 11

  21. ORDERD BY LGV NUMBER 2017 Count % DIFFERENCE LGV HGV LGV HGV Hilperton Drive A361 (N) 4234 58 16% -55% Hilperton Drive A361 (S) 3571 62 6% -50% Hilperton Road A361 3182 25 -11% -76% Staverton B3105 2281 40 -5% -53% Hilperton Relief Road B3106 2139 32 West Ashton Road North of Leap Gate 2102 10 60% -39% Leap Gate B3106 B 1792 11 Leap Gate B3106 A 1742 13 Seymour Road 1733 17 19% -62% West Ashton Road South of Leap Gate 1683 17 28% 3% Wynsome Street 1500 62 2% -11% The Down 1494 11 -2% -81% Marsh Road B3105 West 537 4 -44% -89% Devizes Road B3105 364 3 -37% -68% Holt B3107 North (12hr) 5237 676 17% -21% Holt B3107 South |(12 Hr) 4038 477 27% -22%

  22. ORDERD BY HGV NUMBER 2017 Count % DIFFERENCE LGV HGV LGV HGV Hilperton Drive A361 (S) 3571 62 6% -50% Wynsome Street 1500 62 2% -11% Hilperton Drive A361 (N) 4234 58 16% -55% Staverton B3105 2281 40 -5% -53% Hilperton Relief Road B3106 2139 32 Hilperton Road A361 3182 25 -11% -76% Seymour Road 1733 17 19% -62% West Ashton Road South of Leap Gate 1683 17 28% 3% Leap Gate B3106 A 1742 13 Leap Gate B3106 B 1792 11 The Down 1494 11 -2% -81% West Ashton Road North of Leap Gate 2102 10 60% -39% Marsh Road B3105 West 537 4 -44% -89% Devizes Road B3105 364 3 -37% -68% Holt B3107 North (12hr) 5237 676 17% -21% Holt B3107 South |(12 Hr) 4038 477 27% -22%

  23. Speed Data The 85th percentile is the speed at which 85% of the traffic is travelling at or below. The thresholds for interventions in a 30mph speed limit are: 30 to 35mph = No Further Action (NFA) 35.1 to 42 mph = Eligible for Community Speed Watch Over 42 mph = Subject to Police enforcement

  24. Speed Data cont… The thresholds for interventions in a 40mph speed limit are: 40 to 45.9mph = No Further Action (NFA) 46 to 53 mph = Eligible for Community Speed Watch 49 to 53 mph = eligible for Speed Indicator Device (SID) CSW does not operate in any speed limit above 40mph.

  25. 85 TH %ILE AVERAGE SPEED ACTION LIMIT Hilperton Road A361 (Northeast bound) 32.2 35.5 30 CSW Southwestbound 31.2 34.7 Leap Gate B3106 (A)* Northbound 29.2 33.5 30 CSW Southbound 31.0 37.7 West Ashton Road (North of Leap Gate) Northbound 32.6 38.4 30 CSW Southbound 34.3 38.3

  26. Summary - Count Data • HRR primary objective met: 7.5 T HGV restriction except loading (4 HGVs in the peak hours) • HRR secondary objective met: HGV re-routing leading to reductions on: Down Seymour Road Staverton Hilperton Road Holt Hilperton Drive

  27. Summary – Count Data West Ashton Road (north of Leap Gate) Increase in LGV with decrease in HGV Leap Gate (am + pm) 1,742 LGV 13 HGV Hilperton Relief Road (am + pm) 2,139 LGV 32 HGV

  28. Summary – Speed Data Community Speed Watch Threshold met at 3 locations: • Hilperton Road (Northeast bound at Fairfields) • Leap Gate (Southbound at Saprano Way junction) • West Ashton Road (North of Leap Gate) Northbound Southbound

  29. QUESTIONS

Download Presentation
Download Policy: The content available on the website is offered to you 'AS IS' for your personal information and use only. It cannot be commercialized, licensed, or distributed on other websites without prior consent from the author. To download a presentation, simply click this link. If you encounter any difficulties during the download process, it's possible that the publisher has removed the file from their server.

Recommend


More recommend