Tri-County Health Planning Board of Worcester, Wicomico and Somerset - - PDF document

tri county health planning board of worcester wicomico
SMART_READER_LITE
LIVE PREVIEW

Tri-County Health Planning Board of Worcester, Wicomico and Somerset - - PDF document

Tri-County Health Planning Board of Worcester, Wicomico and Somerset Countie s Reduction in Rate of Diabetes Related ER visits and Racial disparity in ED visit rates Through Evidence-Based Care Management Maryland SHIP Objective 27 Diabetes


slide-1
SLIDE 1

Tri-County Health Planning Board of Worcester, Wicomico and Somerset Counties

Reduction in Rate of Diabetes Related ER visits and Racial disparity in ED visit rates Through Evidence-Based Care Management Maryland SHIP Objective 27

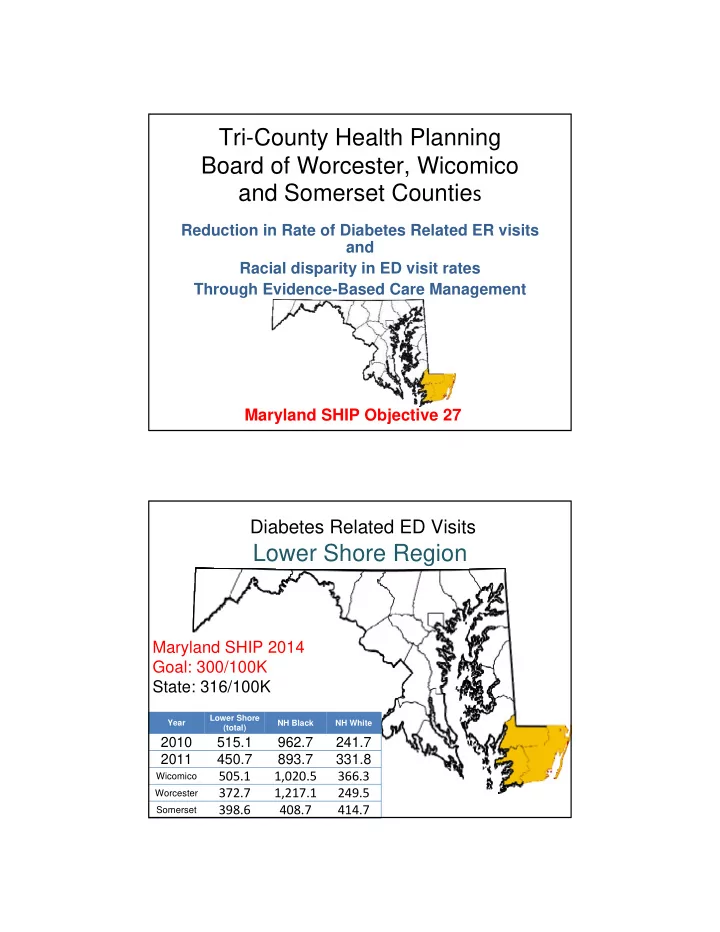
Diabetes Related ED Visits

Lower Shore Region

Maryland SHIP 2014 Goal: 300/100K State: 316/100K

Year Lower Shore (total) NH Black NH White

2010 515.1 962.7 241.7 2011 450.7 893.7 331.8

Wicomico

505.1 1,020.5 366.3

Worcester

372.7 1,217.1 249.5

Somerset

398.6 408.7 414.7

slide-2
SLIDE 2

AGH=24 PRMC=26 Rate=695/100K AGH=25 PRMC= 34 Rate=1173/100K

AGH=73

AGH=165 PRMC=13 Rate=611/100K

Population: 51,578

Year Worcester County (total) NH Black NH White

2010 433.4 1,030.5 364.6 2011 372.7 1,217.1 249.5

PRMC=185 AGH=2 PRMC=25 AGH=1 PRMC=136 AGH=7

Year Wicomico County (total) NH Black NH White

2010 558.1 1,282.1 355.0 2011 505.1 1,020.5 366.3 Population: 100,647

slide-3
SLIDE 3

PRMC=59 AGH= 3

Black=672/100K White=396/100K

PRMC=9 AGH=4

Population: 26,253

Year Somerset County (total) NH Black NH White

2010 513.8 566.4 499.3 2011 398.6 408.7 414.7 AGH ED PRMC ED McCready ED

Wicomico Diabetes Case Manager Team

Worcester Somerset Diabetes

CM Team Medication Reconciliatio n

Home Evaluation

Emergency Physicians Group TLC

EMS/ Ambulance

Lower Shore Connector Entity Apple Drug Rx Assist

slide-4
SLIDE 4

Fund Utilization

Somerset Worcester Wicomico Total Community Health Nurse II (RN) 0.5 FTE 0.5 FTE 1 FTE 2 FTE LCSW –Social Worker 0.25 FTE 0.25 FTE 0.5 FTE 1 FTE Health Outreach worker 0.25 FTE 0.25 FTE 0.5 FTE 1 FTE

Diabetes Management Program Staff

1 FTE 0.25 FTE 0.2 FTE 1.45 FTE Total Staff

5.45 FTE

Data Map/Tracking $7500 Home Visiting costs Travel Supplies Phone, IT $7827

TOTAL CHRC $250,000

Matching funds $25,000

July 1, 2012 through September 30, 2013

Sustainability

  • Diabetes Care Management evolution to billable

service

  • Calculate savings to ED‐ reinvest into program
  • Primary Care partnerships‐ CM builds efficiency,

savings to contract for CM services

  • Public Payer shared savings programs‐ PCMH or

like models

  • Privatization of model‐ evolve to ACO or CHO
  • Community Foundation or NPO funding
slide-5
SLIDE 5

Partnerships

  • TriCounty LHIC
  • 3 Hospitals

 AGH, PRMC, McCready

  • Emergency Physicians Group
  • 3 Local Health Depts
  • Lower Shore Connector Entity
  • Patient Medical Homes
  • TLC‐ FQHC
  • Diabetes Educators/ MNT
  • Apple Drug Pharmacy
  • TriCounty Diabetes Alliance
  • Community Foundation
  • Urgent Care Centers
  • Emergency Services

Responders

  • Other resources/referrals

 Behavioral Health  MA Transportation  MAP, AERS Nurse Managers  Go Getters

Evaluation

  • 1. Quarterly Analysis of 3 ED

data‐ “Hot spots”

  • 2. Universal referral process

into Diabetes Care Management

  • 3. 2 Care Management

Teams provide home evals, medication reviews

  • 4. Patients complete

Diabetes Education programs

  • 5. Patients receive other

services to avoid ED visits

  • 6. CRISP enrollment for CM

teams to promote Community Medical Record

  • 7. Referral for insurer status

to MD Connector Entity Reduced Diabetes Related ED visit rate by October 15, 2014 Reduced racial disparities in ED visit rates by October 15, 2014

slide-6
SLIDE 6

Questions?