
SLIDE 1
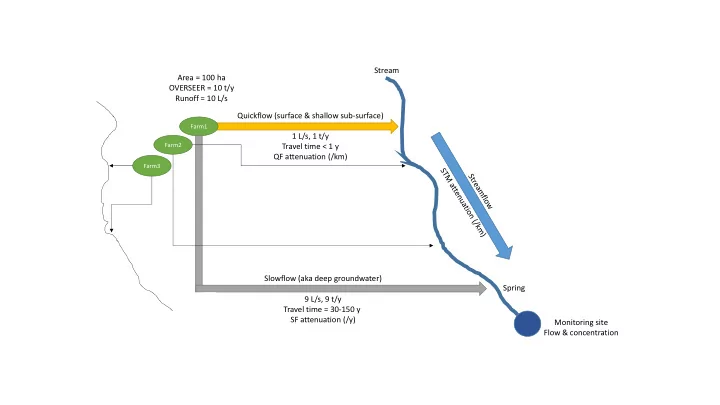
Travel time = 30-150 y SF attenuation (/y) Monitoring site Flow - - PowerPoint PPT Presentation
Stream Area = 100 ha OVERSEER = 10 t/y Runoff = 10 L/s Quickflow (surface & shallow sub-surface) Farm1 1 L/s, 1 t/y Farm2 Travel time < 1 y QF attenuation (/km) Farm3 Slowflow (aka deep groundwater) Spring 9 L/s, 9 t/y Travel