Trabeculectomy Slows or relationships to disclose: Reverses the - - PowerPoint PPT Presentation

trabeculectomy slows or
SMART_READER_LITE
LIVE PREVIEW

Trabeculectomy Slows or relationships to disclose: Reverses the - - PowerPoint PPT Presentation

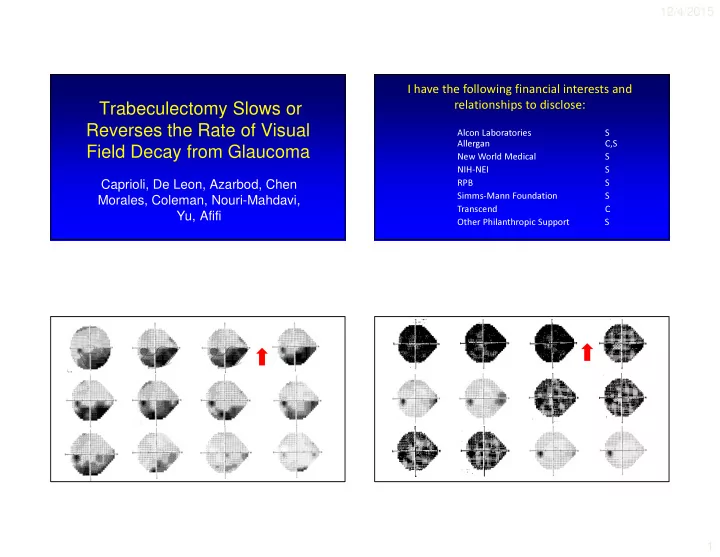
12/4/2015 I have the following financial interests and Trabeculectomy Slows or relationships to disclose: Reverses the Rate of Visual Alcon Laboratories S Allergan C,S Field Decay from Glaucoma New World Medical S NIH-NEI S Caprioli,


slide-1
SLIDE 1

12/4/2015 1

Trabeculectomy Slows or Reverses the Rate of Visual Field Decay from Glaucoma

Caprioli, De Leon, Azarbod, Chen Morales, Coleman, Nouri-Mahdavi, Yu, Afifi I have the following financial interests and relationships to disclose:

Alcon Laboratories S Allergan C,S New World Medical S NIH-NEI S RPB S Simms-Mann Foundation S Transcend C Other Philanthropic Support S

slide-2
SLIDE 2

12/4/2015 2

VF Improvement After Surgery: My Clinical Observations

  • Not a rare phenomenon
  • Not a learning effect
  • Robust decrease in IOP
  • IOP often high pre-op
  • Damage not too bad
  • Patients not too old

Trans Am Acad Ophthalmol Otol 1974

  • Acute reduction IOP with Diamox:

Improvements with manual static perimetry

  • Can’t exclude acute pharmacologic events

independent of disease

Trans Ophthalmol Soc UK 1985

  • Relationship between IOP and VF damage
  • “Unless improvement is noted to accompany

lowering of IOP, adequacy of control cannot be…assured”

Ophthalmol 2005

  • PERG, short term
  • RGC function partially restored after IOP reduction in

glaucomatous eyes with early VF impairment

  • No improvement in eyes with normal VF
slide-3
SLIDE 3

12/4/2015 3

  • Substantial VF improvement at 5 years
  • ∆ MD used as outcome, no rates
  • IOP reduction associated with VF

improvement

Am J Ophthalmol 2014

  • Short term, 3 months
  • ∆ in TD and PSD probability maps used
  • No rates
  • “Biomarker” for RGC response to treatment*

Am J Ophthalmol 2015

Problems to overcome:

  • Signal/Noise; Variability
  • Regression to mean
  • Learning effect
  • Media effects

– Cataract – Ocular surface Experience Magnitude of change Many tests, Fitted trend, Comparison group Comparison group Magnitude of change No cataract surgery

Approach

  • Measure change in rates of individual VF test

locations before and after trabeculectomy

– Long-term (years) – Allow for decaying or improving rates – Retain spatial information

  • Comparison Group, help control for

– Noise – Regression to the mean

slide-4
SLIDE 4

12/4/2015 4

Background

IOVS, 2011,2012, and 2014

Trabeculectomy Group

  • Open-angle glaucoma
  • ≥ 4 VFs before AND after surgery
  • ≥ 2 years before AND after surgery
  • No intercurrent cataract surgery
  • Absence of other VF causes

Comparison Group

  • Open angle glaucoma

– No intercurrent glaucoma or cataract surgery – Clinically “stable”, no ∆ number meds

  • NOT a “treatment control” !
  • ≥ 8 VFs, ≥ 4 years

– “Mock surgery” at half follow-up – Rates fit for first and second half of follow-up

Methods

  • Pointwise exponential regression
  • Allow for decay or improvement within testing boundaries,

with (-) or (+) rates

  • Group analyses:

– Trabeculectomy group: pre and post surgery – Comparison group: pre and post “mock surgery”

  • Entire analysis repeated with:

– Linear model (PLR) – Requirement for tighter fits (p < .10)

slide-5
SLIDE 5

12/4/2015 5

Methods

  • Rates at each location
  • Counts of decay and improving
  • Locations of decay and improving
  • Multivariate regression of potential factors

associated with improving

Upper limit of age and location matched normal value Lower limit of perimetric testing, 0 dB

slide-6
SLIDE 6

12/4/2015 6

Trabeculectomy Group Comparison Group

Number of eyes 74 71 Number of patients 65 55 Age (mean ± SD) 61.4 ± 12.6 62.5 ± 10.0 Pre Post 1st half 2nd half VF follow-up duration 5.1 ± 2.1 5.4 ± 2.3 5.1 ± 2.0 5.0 ± 1.7 Number of VF’s ± SD 8.9 ± 4.7 9.0 ± 4.4 5.7 ± 2.7 6.2 ± 2.6 Initial MD (mean ± SD)

  • 7.2 ± 5.3
  • 5.6 ± 4.3

Final MD (mean ± SD)

  • 10.7 ± 6.4
  • 8.2 ± 5.1

Mean 14.3 ± 2.9 Mean 10.0 ± 3.6

Pre- and Post- Op IOP Trabeculectomy Group

x x x x x x x x x

Gray scale

  • f Rates
slide-7
SLIDE 7

12/4/2015 7

Decay followed by Improvement Improvement followed by Decay

What about eyes?

Proportion of eyes with ≥ 5 more locations improving post op: Proportion of eyes with ≥ 10 more locations improving post op: Difference from Comparison Group:

Χ2 for exp, linear, or only best fits

80% 57% p = 0.0000

Multivariate Analysis for Improvement (Trabeculectomy)

  • Age (baseline)

p = 0.76

  • MD (baseline)

p = 0.83

  • VFI (baseline)

p = 0.65

  • ∆ IOP

p = 0.009

N Improving (post-pre) IOP (post – pre)

r = 0.33 p = 0.001

Number of improving locations as a function of IOP reduction after surgery

More VF improvement More IOP reduction

slide-8
SLIDE 8

12/4/2015 8

Ophthalmology 2015

Summary

  • Trabeculectomy slows or reverses glaucomatous VF

damage

  • Reversal of rates from decay to improvement is common
  • Duration of improvement is years
  • The proportion of points improving post-op depends on the

magnitude of IOP reduction

  • Similar results with linear model and requirement for tighter

fits

Implications

  • Robust IOP reduction can reverse glaucomatous

visual loss!

  • Hypothesis: Sick but not dead RGCs
  • Prolonged agonal period
  • Opportunity for intervention
  • Reversal of VF loss should be a goal of treatment*
  • Regional indices more meaningful than global

indices (MD, VFI) when used as treatment outcome measure

Clinical Research Team

Authors Others

  • Abdolmonem Afifi
  • Parham Azarbod
  • Joseph Caprioli
  • Anne Coleman
  • Mark De Leon
  • Esteban Morales
  • Kouros Nouri-Mahdavi
  • Fei Yu
  • Niloufar Abdollahi
  • Elena Bitrian
  • Nila Cirineo
  • Joon Mo Kim
  • Ji Woong Lee
  • Junmo Lee
  • Dennis Mock
  • Meera Ramanathan
  • Niloufar Abdollahi
  • Elena Bitrian
  • Nila Cirineo
  • Joon Mo Kim
  • Ji Woong Lee
  • Junmo Lee
  • Dennis Mock
  • Meera Ramanathan