
Japan
Japan’s economy slows as confidence slides ahead of sales tax rise
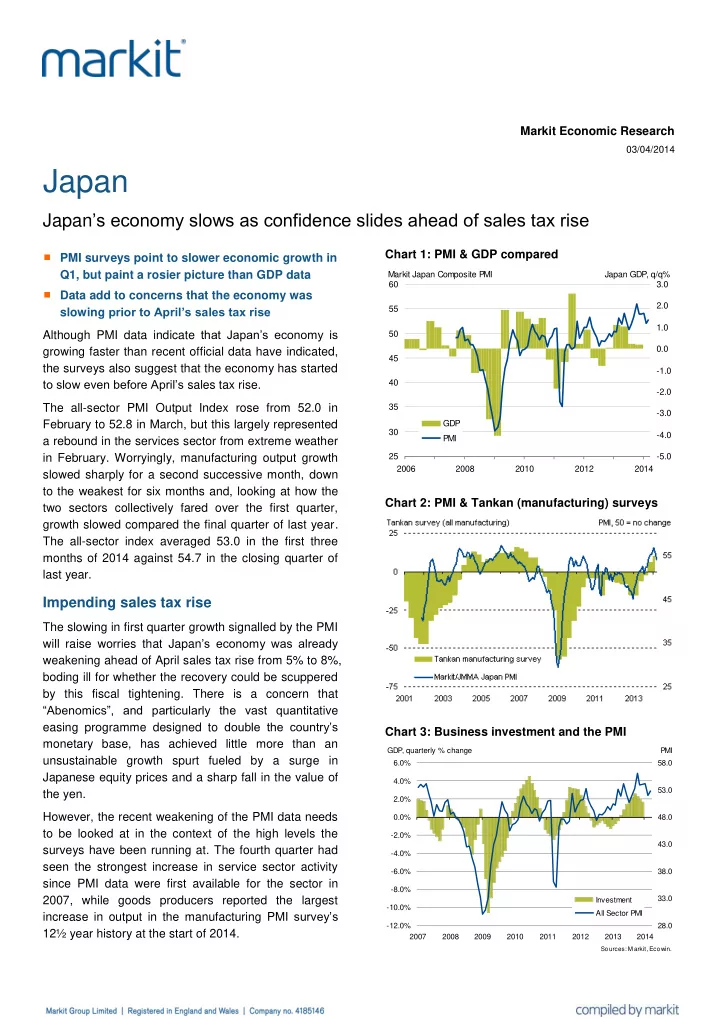
- PMI surveys point to slower economic growth in
Q1, but paint a rosier picture than GDP data
- Data add to concerns that the economy was
slowing prior to April’s sales tax rise Although PMI data indicate that Japan’s economy is growing faster than recent official data have indicated, the surveys also suggest that the economy has started to slow even before April’s sales tax rise. The all-sector PMI Output Index rose from 52.0 in February to 52.8 in March, but this largely represented a rebound in the services sector from extreme weather in February. Worryingly, manufacturing output growth slowed sharply for a second successive month, down to the weakest for six months and, looking at how the two sectors collectively fared over the first quarter, growth slowed compared the final quarter of last year. The all-sector index averaged 53.0 in the first three months of 2014 against 54.7 in the closing quarter of last year.
Impending sales tax rise
The slowing in first quarter growth signalled by the PMI will raise worries that Japan’s economy was already weakening ahead of April sales tax rise from 5% to 8%, boding ill for whether the recovery could be scuppered by this fiscal tightening. There is a concern that “Abenomics”, and particularly the vast quantitative easing programme designed to double the country’s monetary base, has achieved little more than an unsustainable growth spurt fueled by a surge in Japanese equity prices and a sharp fall in the value of the yen. However, the recent weakening of the PMI data needs to be looked at in the context of the high levels the surveys have been running at. The fourth quarter had seen the strongest increase in service sector activity since PMI data were first available for the sector in 2007, while goods producers reported the largest increase in output in the manufacturing PMI survey’s 12½ year history at the start of 2014. Chart 1: PMI & GDP compared
25 30 35 40 45 50 55 60 2006 2008 2010 2012 2014
- 5.0
- 4.0
- 3.0
- 2.0
- 1.0
0.0 1.0 2.0 3.0 GDP PMI Markit Japan Composite PMI Japan GDP, q/q%
Chart 2: PMI & Tankan (manufacturing) surveys Chart 3: Business investment and the PMI
- 12.0%
- 10.0%
- 8.0%
- 6.0%
- 4.0%
- 2.0%
0.0% 2.0% 4.0% 6.0% 2007 2008 2009 2010 2011 2012 2013 2014 28.0 33.0 38.0 43.0 48.0 53.0 58.0 Investment All Sector PMI GDP, quarterly % change PMI
Sources: M arkit, Ecowin.
Markit Economic Research
03/04/2014