
SLIDE 1
TOWN OF REDINGTON BEACH - CURRENT DESIGN STORM EVENT PER - - PDF document
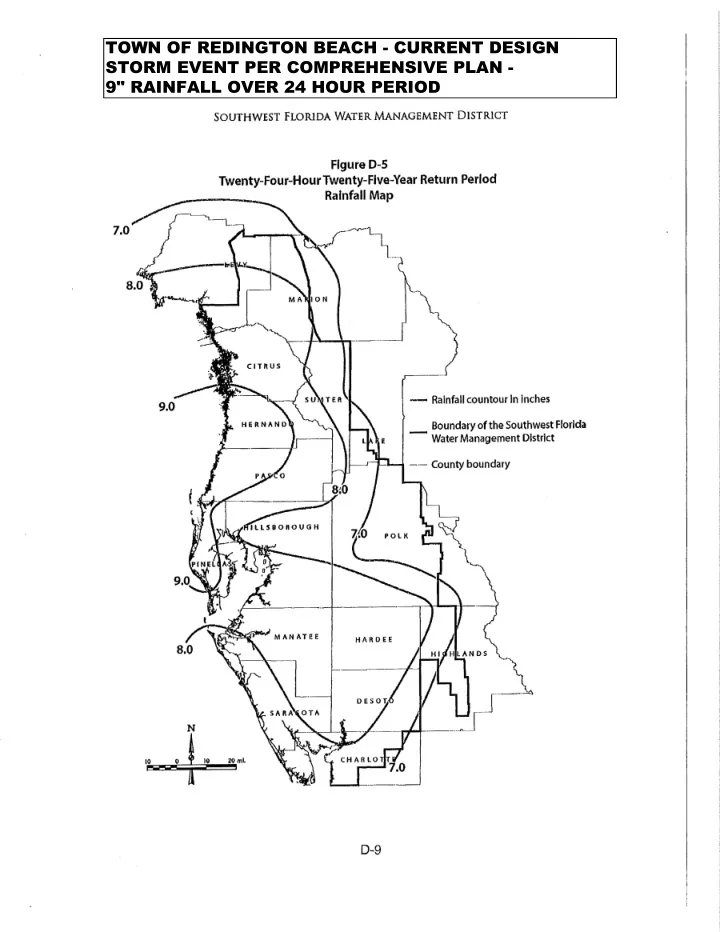
TOWN OF REDINGTON BEACH - CURRENT DESIGN STORM EVENT PER COMPREHENSIVE PLAN - 9" RAINFALL OVER 24 HOUR PERIOD MODRET HYDROGRAPH DATA INPUT - RATIONAL HYDROGRAPH METHOD Project Name : Standard 60' x 100' Lot EXISTING CONDITION
Project Name : Standard 60' x 100' Lot
Contributing Basin Area 0.14 ac. Runoff Coefficient C 0.20 Time of Concentration 10.00 min. Rainfall Depth 9.00 in. Storm Duration 24.00 hrs Analysis Date: 7/11/2019 EXISTING CONDITION (PRE-DEVELOPMENT - NO IMPERVIOUS)
HYDROGRAPH : Standard 60' x 100' Lot Qpeak: 0.0105 cfs Time of peak: 0.2 hrs Vtotal: 908 ft³
Time (hrs) 24 23 22 21 20 19 18 17 16 15 14 13 12 11 10 9 8 7 6 5 4 3 2 1 Runoff (cfs) 0.01 0.009 0.009 0.008 0.008 0.007 0.007 0.006 0.006 0.005 0.005 0.004 0.004 0.003 0.003 0.002 0.002 0.001 0.001 0.000
Project Name : Standard 60' x 100' Lot
Contributing Basin Area 0.14 ac. Runoff Coefficient C 0.40 Time of Concentration 10.00 min. Rainfall Depth 9.00 in. Storm Duration 24.00 hrs Analysis Date: 7/11/2019
HYDROGRAPH : Standard 60' x 100' Lot Qpeak: 0.0210 cfs Time of peak: 0.2 hrs Vtotal: 1,816 ft³
Time (hrs) 24 23 22 21 20 19 18 17 16 15 14 13 12 11 10 9 8 7 6 5 4 3 2 1 Runoff (cfs) 0.021 0.02 0.02 0.019 0.018 0.018 0.017 0.017 0.016 0.016 0.015 0.015 0.014 0.014 0.013 0.013 0.012 0.012 0.011 0.011 0.01 0.01 0.009 0.009 0.008 0.008 0.007 0.007 0.006 0.006 0.005 0.005 0.004 0.004 0.003 0.003 0.002 0.002 0.001 0.001 0.000
Project Name : Standard 60' x 100' Lot
Contributing Basin Area 0.14 ac. Runoff Coefficient C 0.50 Time of Concentration 10.00 min. Rainfall Depth 9.00 in. Storm Duration 24.00 hrs Analysis Date: 7/11/2019
HYDROGRAPH : Standard 60' x 100' Lot Qpeak: 0.0262 cfs Time of peak: 0.2 hrs Vtotal: 2,270 ft³
Time (hrs) 24 23 22 21 20 19 18 17 16 15 14 13 12 11 10 9 8 7 6 5 4 3 2 1 Runoff (cfs) 0.026 0.025 0.024 0.023 0.022 0.021 0.02 0.019 0.018 0.017 0.016 0.015 0.014 0.013 0.012 0.011 0.01 0.009 0.008 0.007 0.006 0.005 0.004 0.003 0.002 0.001
Project Name : Standard 60' x 100' Lot
Contributing Basin Area 0.14 ac. Runoff Coefficient C 0.60 Time of Concentration 10.00 min. Rainfall Depth 9.00 in. Storm Duration 24.00 hrs Analysis Date: 7/11/2019
HYDROGRAPH : Standard 60' x 100' Lot Qpeak: 0.0315 cfs Time of peak: 0.2 hrs Vtotal: 2,723 ft³
Time (hrs) 24 23 22 21 20 19 18 17 16 15 14 13 12 11 10 9 8 7 6 5 4 3 2 1 Runoff (cfs) 0.031 0.03 0.029 0.028 0.027 0.026 0.025 0.024 0.023 0.022 0.021 0.02 0.019 0.018 0.017 0.016 0.015 0.014 0.013 0.012 0.011 0.01 0.009 0.008 0.007 0.006 0.005 0.004 0.003 0.002 0.001
DEP-WMD – AH Volume I Design Aids Guidelines for SFR June 19, 2013 DA 2-4
DEP-WMD – AH Volume I Design Aids Guidelines for SFR June 19, 2013 DA 2-5
The following web sites may provide the applicant with additional information and ideas for their project:
areas can be found at DEP’s Water Data Central - http://www.dep.state.fl.us/water/datacentral/
USDA’s Natural Resources Conservation Service (NRCS) Soils website at http://soils.usda.gov/
http://water.epa.gov/polwaste/green/index.cfm
DEP-WMD – AH Volume I Design Aids Guidelines for SFR June 19, 2013 DA 2-1
Reduce the amount of impervious surface proposed for your project. This will reduce the amount
a 2,000 ft2 roof produces 312 gallons of runoff?) Efforts to reduce the amount of impervious and areas where alternative design and construction techniques or alternative construction materials will be used should be described in the application and shown on the plans where possible. Ways to reduce the amount of impervious surface can include, but are not limited to:
Constructing the driveway with two wheel tracks with grass in the middle instead of solid concrete
Figure 2a. (Source: Google Images.)
Construct the driveway using gravel (not limerock) instead of solid concrete or asphalt. See Figure 2b.
Figure 2b (Source: Google Images.)
Construct the driveway using paving stones with grass in between instead of solid concrete or
Figure 2c (Source: Google Images.)
DEP-WMD – AH Volume I Design Aids Guidelines for SFR June 19, 2013 DA 2-2
pavers, or wheel tracks and invert the crown, or center line of the driveway so that runoff flows toward the middle and not to the outside edges. See Figure 2d.
Figure 2d. Example driveway cross section. (Note: scale is exaggerated.)
As much as possible, direct stormwater runoff from rooftops and other impervious surfaces onto grassed areas or into rain gardens, landscaping and flower beds. Doing this will slow down the runoff allowing some of it to percolate into the ground or evaporate into the air, which will reduce the chances of causing offsite flooding. Efforts to minimize and redirect stormwater runoff to grassed or landscaped areas should be described in the application and shown on the plans to the extent possible. Please see Figures 3a and 3b, below.
Figure 3a. Roof gutter down spout Figure 3b. Roof gutter down spout draining onto a concrete driveway draining onto grass
Fill material to be used for the house pad and/or driveway must be clean (without rubbish or vegetative material) and it should drain well. Specifications for the fill material to be used in the project should be included in the supporting information submitted with the permit application. The pre-development drainage patterns must be maintained as much as possible. Adding vegetated swales and/or buffer strips to intercept and direct runoff to pre-development locations may be
CITY OF HOLMES BEACH PUBLIC WORKS STANDARD DETAIL 1.04 11-2013 LTB NTS
MATCH EX. GRADE AT PROPERTY LINE 12" DEPTH COMMERCIAL GRADE # 57 STONE (TESTED TO A 40% VOID (SSD)))
OVEREXCAVATE TO WATER LEVEL OR UNTIL CLEAN SAND IS ENCOUNTERED AND BACKFILL TRENCH WITH CLEAN SAND OR SHELL INSTALL FILTER FABRIC (MIRAFI N SERIES FABRIC OR EQUIV) ON BOTH SIDES OF TRENCH AND BELOW TOP LAYER OF STONE 6" DEPTH COMMERCIAL GRADE #57 STONE
Town of Redington Beach ISR Options and Impacts to Stormwater Requirements For Typical 60' x 100' Lot Lot Size = 0.14 Acres Total Runoff Volume ISR Results @ Pre (CF) Post (CF) Required Retention Volume(CF) 40% 908 1816 908 50% 908 2270 1362 60% 908 2723 1815 *Increasing the ISR from 40% to 60% doubles the amount of stormwater required. **Increasing the ISR reduces the space available for much needed green space and stormwater retention. Analysis Prepared by Lynn T. Burnett, P.E., CFM 7/10/2019