town of portland van buren point 2011 333 059 2011 school
play

Town of Portland Van Buren Point 2011 $333,059 2011 School Taxes - PowerPoint PPT Presentation

Town of Portland Van Buren Point 2011 $333,059 2011 School Taxes Paid 2012 $41.2352700 $384,707 2012 School Taxes Paid 1000 Rate per $9,329,570 Value Total Taxable Assessed Fredonia School District 2012 Paid Extra $35.6992800


  1. Town of Portland ­ Van Buren Point 2011 $333,059 2011 School Taxes Paid 2012 $41.2352700 $384,707 2012 School Taxes Paid 1000 Rate per $9,329,570 Value Total Taxable Assessed Fredonia School District 2012 Paid Extra $35.6992800 $5.5359900 Difference $51,648 My name is Bill Ploetz, a resident of Dayswoods, on the west edge of Van Buren Point. My goal is to inform the VBP group what has happened to the property taxes in the Town of Portland, especially the school taxes for those of us in Fredonia School District and why they have jumped so significantly. Before I get started, I wanted to point out a couple quick things related to the Town of Portland. Town Board meeting 7PM Wednesday July 10. If you want to express your opinion on whether the Town should re-appoint the current assessor to a 6 year contract, be there. I think there is a petition going around about that too. We need to have as many as possible attend for support. Voting Rights for out of town property owners – We have found that there is a procedure for granting certain voting rights to out of town NY State property owners. The Town lawyer is working on that. Now back to taxes. 
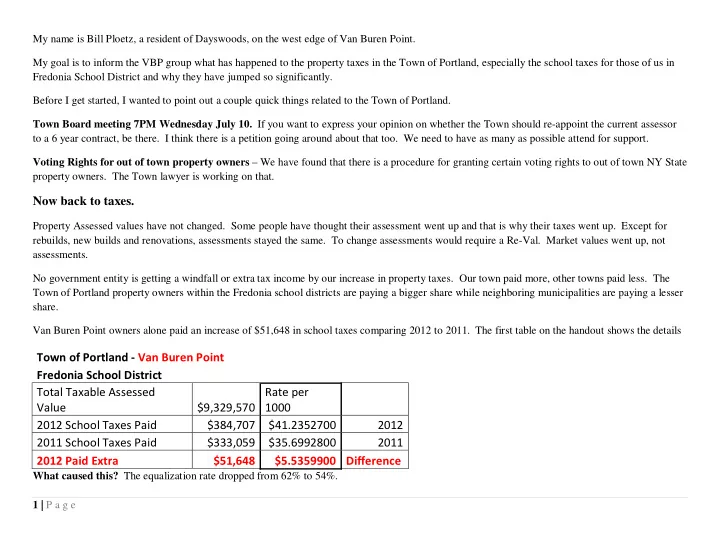
Property Assessed values have not changed. Some people have thought their assessment went up and that is why their taxes went up. Except for rebuilds, new builds and renovations, assessments stayed the same. To change assessments would require a Re-Val. Market values went up, not assessments. No government entity is getting a windfall or extra tax income by our increase in property taxes. Our town paid more, other towns paid less. The Town of Portland property owners within the Fredonia school districts are paying a bigger share while neighboring municipalities are paying a lesser share. Van Buren Point owners alone paid an increase of $51,648 in school taxes comparing 2012 to 2011. The first table on the handout shows the details What caused this? The equalization rate dropped from 62% to 54%. 1 | P a g e

  2. $14,429,615 87.18% $8,129,473 55.00% $181,019 $40.48554 $4,471,210 $1,503,780 $5,974,990 Arkwright $110.18 87.18% 20.21% $473,469,490 1.50% $95,688,184 $110.17836 $10,542,767 $115,555,330 $19,867,146 Pomfret $41.24 4.92% 4.92% $26,721,509 54.00% $595,009 $41.23527 1.50% $40.49 $1,277,260 $7,572,897 Totals $31.81 6.30% 6.30% $34,227,216 70.00% $762,139 $31.81007 $23,959,051 $31,531,948 Dunkirk Sheridan $30.30 0.10% 0.10% $543,265 73.50% $12,097 $30.29530 $399,300 $148,490 $547,790 $12,093,032 $15,706,875 $138,947,360 Portland $87.03 $543,090,953 100.00% 100.00% Equalization Rate shows as Uniform Percentage of Value on your Property tax bill. Divide your assessed value by the Equalization Rate to get the State “Calculated” market value. The school budget only went up by about 2% so why did your taxes go up by at least 15%? Because of the drop in equalization rate. The Equalization Rate is used to spread the cost of the school budget across all the townships within the school district based on market value, not assessed value. This is the value the state uses, not really a true market value. School taxes are distributed based on market values in a township, not assessed values. Then the state has to calculate backwards to get each towns school tax rate per $1000 of assessed value. The details on how the School Tax rate per $1000 is calculated is page 2 of the handout. It is a little too much to go over in this brief presentation. � Take the taxable assessed value of all the property in the town. Divide it by the equalization rate to get the market value for the town � Take the Market Value and divide it by the Total Market Value of all the properties in the school district to get the percentage of the total market value. � Take the percentage of total Market Value and multiply it by the Total School Tax burden to get the percentage of burden. � Multiply the percentage of burden times the total burden times 1000 to get the towns tax rate per $1000 of assessment. Our equalization rate dropped from 62% to 54%, making our property values increase significantly and causing us to pay a bigger share of school budget white other towns’ share decreased. Her is a chart with the calculations. Fredonia School District 2013 Property Taxes AV Assessed School Value Rate ER MV % of Burden/ Total School per Equalization Market Total % of $1000 Township Assessed Less STAR Taxable $1000 AV Burden Rate Value MV Burden AV What are we doing about it? 2 | P a g e

  3. The town is filing a complaint about the equalization rate. We missed the opportunity last year because no one understood what would happen to our share of the taxes and the window of opportunity is very small. There is only 1 week from the time the town is notified of the proposed equalization rate and when a complaint has to be filed. Last year, the assessor did not point out that there would be such an impact and agreed with the change increasing our property values. The town has approved up to $5000 in legal fees to support this case. A lawyer has been contracted and will be making the presentation to the state. We received an extension from 6/27/13 to 7/10/13. We have provided the lawyer with our findings, research and recommendations of a 66% equalization rate and are now awaiting the lawyer’s direction. The studies we have done include in-depth statistical analysis and spreadsheets evaluating the data and methods the state used in determining our market value. We had to invoke the Freedom of Information Act to get some of the data. Unfortunately, we found out that information is not free and fees were involved because of the amount of data we requested and that timeliness is not their strong point. All said and done, here is a summary of what we determined. � We were given incomplete and inaccurate info from the Town Assessor at the beginning of our study. � Sales data was not used in the valuations. � No real appraisals were used in calculating non-residential property values. We had independent valuations done by a prominent realtor which pointed out many of the gross over-valuations. � Errors have been made in assumptions by the state. We are questioning their starting points for property values and past assumptions. � According to the state, property values in Town of Portland have been increasing at a high rate while the rest of the country and other similar areas have been decreasing since the real estate burst in 2007. That means we must all have a pot of gold and don’t know it? Values in Towns of Pomfret and Sheridan have been steady or declining while Portland is escalating? See charts on following pages. � The assessor and town were given opportunity to address this before the rates were finalized in 2012 and did not take the initiative to file a complaint or study the results even before that, while there was an opportunity. � We feel the rate should be bumped back to 66% based on our valuations. What happens if the state does not comply? Then we have to decide where to go from there, based on the lawyer’s advice, how much money is left from the Town and how to raise money to pay for legal expenses if we go further. 3 | P a g e

  4. Average Annual Full Market Value of Property from 2005 to 2012 Residential US and Cleveland compared to Portland Residential, Commercial, and New York State (CAMA) 200% 180% 160% 140% /100% $100,000 US Residential (Indexed) $80,000 (Indexed) Cleveland Residential $60,000 NYS CAMA $40,000 Portland Residential Portland $20,000 Commercial $0 2005 2006 2007 2008 2009 2010 2011 2012 4 | Page

  5. appreciate for over $21 million? 2 or more years, how could they Town of Portland Residential Market Value Increase according to CAMA Studies of 952 out of 1546 residential properties using 2009 as a base point. Note the same 952 parcels were used in 30.00% 25.00% 20.00% 15.00% 10.00% 5.00% 0.00% Year 2009 Year 2010 Year 2011 Year 2012 5 | Page

  6. Comparing Growth of Town of Portland to Town of Sheridan ­ Very similar town Note how "Market" values in Sheridan have been going down, but Portland has "exploded" That just doesn't make sense 50.00% 40.00% 30.00% Total 20.00% A(Residential) 10.00% B(Commercial) 0.00% C(Vacant Land) Portland Sheridan Portland Sheridan Portland Sheridan ­10.00% 2010 2010 2011 2011 2012 2012 ­20.00% ­30.00% 6| Page

  7. ­30.00% 2010 C(Vacant Land) B(Commercial) A(Residential) Total Note: Huge spike in value of Vacant parcels for 2012 Using 2006 as a base point for comparison Town of Portland - Growth in "Market" value 2012 2011 2009 ­20.00% 2008 2007 2006 50.00% 40.00% 30.00% 20.00% 10.00% 0.00% ­10.00% 7 | Page

  8. 0.00% Pomfret These rates were downloaded from the NY state tax website. Observations of ER and RAR from 2006 ­ 2012 ­ The ER ends up being the final determination of how are property values are affected. 2006­2012 2007­2012 2008­2012 2009­2012 2010­2012 2011­2012 Observations of ER from 2006 ­ 2012 ­ The ER ends up being the final determination of how are property values are affected. Equalization Rate change as a Percentage ­ Portland as compared to other towns in Chautauqua County Westfield Villenova Portland Poland 5.00% Hanover Ellington Dunkirk Arkwright C\O Dunkirk 45.00% 40.00% 35.00% 30.00% 25.00% 20.00% 15.00% 10.00% 8 | Page

Download Presentation
Download Policy: The content available on the website is offered to you 'AS IS' for your personal information and use only. It cannot be commercialized, licensed, or distributed on other websites without prior consent from the author. To download a presentation, simply click this link. If you encounter any difficulties during the download process, it's possible that the publisher has removed the file from their server.

Recommend


More recommend