
SLIDE 1
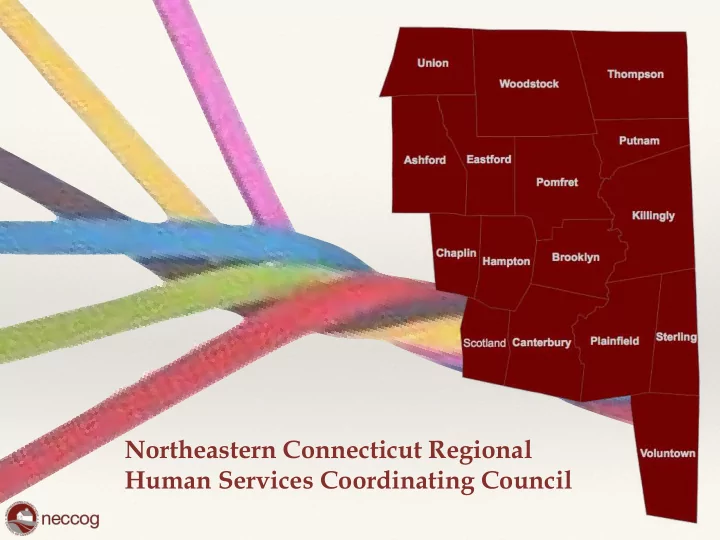
Northeastern Connecticut Regional Human Services Coordinating Council
Northeastern Connecticut Regional Human Services Coordinating - - PowerPoint PPT Presentation
Northeastern Connecticut Regional Human Services Coordinating Council there shall be established a regional human services coordinating council for each planning region to encourage collaborations that will foster the development and
Northeastern Connecticut Regional Human Services Coordinating Council
…there shall be established a regional human services coordinating council for each planning region…
…to encourage collaborations that will foster the development and maintenance
and human services system in the region.
Section 17a-760 - CGS
9 COGs
the action of working with someone to produce
the action or process of working together to achieve common interests rather than by acting independently
Connecticut Plan of Conservation and Development
104,13 3 95,850 89,533 82,211 73,433 66,784
27,500 55,000 82,500 110,000
2025 2012 2000 1990 1980 1970
Population
Population Growth in the Region
111 283 128 116 60 76 358 360 105 469 92 140 200 33 67 131 412 230 371 741
200 400 600 800
Ashford Brooklyn Canterbury Chaplin Eastford Hampton Killingly Plainfied Pomfret Putnam Scotland Sterling Thompson Union Voluntown Woodstock NL County W County T County Connecticut
Population Per Square Mile
40 38 39 38 41 45 41 46 48 40 40 42 39 42 36 43 42 43
0. 12. 24. 36. 48. 60.
US CT Region Ashford Brooklyn Canterbury Chaplin Eastford Hampton Killingly Plainfield Pomfret Putnam Scotland Sterling Thompson Union Voluntown
2012 Median Age
4,306 8,180 5,111 2,412 1,690 1,799 17,345 15,358 4,231 9,562 1,725 3,786 9,429 954 2,599 7,934 418 1,190 613 316 249 280 2,405 1,887 450 1,623 206 363 1,336 158 304 1,197
5000 10000 15000 20000 25000
Ashford Brooklyn Canterb… Chaplin Eastford Hampton Killingly Plainfield Pomfret Putnam Scotland Sterling Thompson Union Voluntown Woodstock
Total Population 65 Years and Over
Persons Over the Age of 65
2014 CT Distressed Municipalities
Since 1999 Five Towns in the Region have been designated Distressed Municipalities. Two towns, Killingly and Putnam, have been on the list all 15
(4) - Thompson (4) been on the list.
Federally Distressed Municipalities
County or municipal governments that qualify as economically distressed communities by the EDA, must meet one or more of the following distress criteria, found in 13 CFR §301.3(a)(1): An unemployment rate that is, for the most recent twenty-four (24) month period for which data are available, at least one (1) percentage point greater than the national average unemployment rate; Per capita income that is, for the most recent period for which data are available, eighty (80) percent or less of the national average per capita income; or A Special Need, as determined by EDA. Brooklyn, Killingly, Plainfield and Sterling each are currently considered economically
the national average for every individual month in the 24-month period.
14.0% 10.5% 11.5% 21.9% 6.2% 6.6% 11.2% 14.3% 14.8% 10.5% 7.5% 14.3%
0% 6% 11% 17% 22% 28%
US CT Region Villages
SNAP Unemployment Below Poverty
SNAP, Unemployment and Poverty Percentages
Percentage of SNAP recipients that are Elderly
27% 31% 34%
0. 0.1 0.2 0.3 0.3 0.4
US CT Region
Percentage of Elderly SNAP Recipients
Poverty Rates by Education Levels
27% 14% 10% 4% 23% 10% 7% 3% 17% 6% 5% 4%
Less than HS HS Some College Bachelor's or More
US CT Region
Percentage of Elderly Living Below the Poverty Line
12% 14% 15%
0. 0. 0.1 0.1 0.2 0.2
US CT Region
Below Poverty Line
6% 6% 5% 3% 6% 4% 9% 7% 4% 8% 5% 6% 5% 4% 5% 4% 12% 10% 3% 4% 6% 7% 10% 9% 6% 16% 1% 12% 5% 1% 1% 5%
0% 4% 8% 12% 16% 20%
Ashford Brooklyn Canterbury Chaplin Eastford Hampton Killingly Plainfield Pomfret Putnam Scotland Sterling Thompson Union Voluntown Woodstock
1999 2012
Changes in Poverty Rates : 1999 and 2012
1,869 3,040 2,188 996 776 800 7,534 6,336 1,624 4,258 657 1,395 4,013 448 1,140 3,630
2,000 4,000 6,000 8,000
Ashford Brooklyn Canterbury Chaplin Eastford Hampton Killingly Plainfield Pomfret Putnam Scotland Sterling Thompson Union Voluntown Woodstock
2012 Housing Units
Types of Housing Stock
62% 29% 9%
0% 18% 35% 53% 70%
StateState
Owner Rental Vacant
73% 17% 10%
0% 20% 40% 60% 80%
RegionRegion
Percentage of 2, 3-4, 5-9 Rental Units to All Housing
9% 9% 6% 9% 7% 4% 12% 9% 5%
2 Units 3-4 Units 5-9 Units CT Region Villages
Percentage of 10-19, 20+ and Mobile Homes : Units to All Housing
4% 8% 0% 2% 2% 3% 2% 3% 3%
10 to 19 20 + Mobile Homes CT Region Villages
84 378 155 36 24 44 1,090 1,003 61 660 13 67 309 12 62 99 412 7,001 4,806
2000 4000 6000 8000
Ashford Brooklyn Canterbury Chaplin Eastford Hampton Killingly Plainfied Pomfret Putnam Scotland Sterling Thompson Union Voluntown Woodstock NL County W County T County
Total Assisted Housing Units
Connecticut - 168,655
Age of Housing Stock
23% 36% 41%
0% 11% 21% 32% 42% 53%
StateState
Pre-1939 1940-1969 1970-Present
23% 23% 54%
0% 15% 30% 45% 60%
RegionRegion
Percentage of Renters Spending over 30% of their Income on Gross Rent
36% 29% 35% 57% 32% 31% 32% 35% 35%
1CT Region Ashford Brooklyn Eastford Hampton Killingly Plainfield Putnam
Hourly Salary Needed to Afford a 2BR Apartment
$20.33 $22.00 $18.33 $18.69 $24.29
0. 6.25 12.5 18.75 25. 31.25 New London Tolland Windham Region State
night in the United States.
considered "chronically homeless” individuals.
homeless” people in families.
conducted, community by community, on a single night in January every other year.
State Homeless Populations
(Based on Last Place of Residence)
Regional Homeless Populations State Homeless Populations
Chronically Homeless Estimates
Northeastern CT: 47 Southeastern CT: 36 Greater Hartford: 362 Waterbury/Litchfield: 50 Fairfield County: 231 Greater New Haven: 189 Meriden/Middlesex/ Wallingford: 90 Central CT: 103
2,389 3,798 2,672 1,159 877 960 8,788 7,954 2,333 4,459 895 1,849 4,858 434 1,395 3,880
2250 4500 6750 9000 11250
Ashford Brooklyn Canterbury Chaplin Eastford Hampton Killingly Plainfied Pomfret Putnam Scotland Sterling Thompson Union Voluntown Woodstock
Persons Employed
80 147 81 46 51 24 492 334 126 362 22 53 168 15 47 167
125 250 375 500 625
Ashford Brooklyn Canterbury Chaplin Eastford Hampton Killingly Plainfied Pomfret Putnam Scotland Sterling Thompson Union Voluntown Woodstock
All Industries - Number of Employers
95% 89% 95% 97% 92% 98% 82% 91% 88% 78% 98% 75% 47% 85% 79% 69% 5% 11% 6% 3% 8% 2% 19% 9% 12% 22% 2% 25% 53% 15% 21% 31%
0% 25% 50% 75% 100% 125%
Ashford Brooklyn Canterb… Chaplin Eastford Hampton Killingly Plainfield Pomfret Putnam Scotland Sterling Thompson Union Voluntown Woodst…
In State Out of State
Where People Work
5% 6% 1% 2% 7% 5% 2% 3% 4% 1% 6% 7% 3% 7% 4% 4% Ashford Brooklyn Canterbury Chaplin Eastford Hampton Killingly Plainfield Pomfret Putnam Scotland Sterling Thompson Union Voluntown Woodstock
People Working At Home
Estimated Employment and Population 1977, 1985 & 2015
25,301 28,458 27,900 28,231 30,598 50,672 2,930 1,995 5,490 27,600 23,244 23,503 58,961 63,842 96,199
25,000 50,000 75,000 100,000 125,000
1977 1985 2015
Estimated Employment Labor Force Unemployed Not in Labor Force Total Population
Employment by Industry 1985 & 2015
15.2 36.2 19.1 24.4 43.5 13.5 3.1 8.5 3.1 5.6
0. 12.5 25. 37.5 50.
1985 2015
Education/Health Trade/Trans./Utilities Manufacturing Leisure/Hospitality Professional/Businnes
$4.14 $4.60 $7.91 $13.58 $25.29
$0.00 $7.50 $15.00 $22.50 $30.00
Region Avg.Hourly Wage 1970 1977 1985 2015 Adjusted for Inflation
Historical Manufacturing Wages
1985 and 2015 Unemployment Rate
6% 7% 5% 6% 9% 6% 8% 5% 8% 8% 6% 6% 7% 7% 7% 6% 7% 7% 6% 4% 8% 6% 7% 5% 7% 7% 4% 5% 5% 5% 8%
0. 0. 0. 0.1 0.1Woodstock Voluntown Union Thompson Sterling Scotland Putnam Pomfret Plainfield Killingly Hampton Eastford Chaplin Canterbury Brooklyn Ashford Region CT US
2015 1985
Unemployment Rates 1994 - 2013
0. 2.5 5. 7.5 10. 12.5
1994 1995 1996 1997 1998 1999 2000 2001 2002 2003 2004 2005 2006 2007 2008 2009 2010 2011 2012 2013
US CT Region
6.2 6.6 5.5 7.1 6.6 6.6 5.6 6.2 7.9 8.3 5.0 7.5 5.7 8.5 6.1 5.2 6.7 5.6
0. 2.3 4.5 6.8 9.
U.S. CT Ashford Brooklyn Canterbury Chaplin Eastford Hampton Kiliingly Plainfield Pomfret Putnam Scotland Sterling Thompson Union Voluntown Woodstock
Unemployment: 2014
CT US
Has Not Worked Last 30 Days
(Length of Time Since Last Paid Employment)
14% 35% 22% 27% 5%
Less Than 6 Months At least 6 months > 1 Year 1 - 2 Years 2 - 4 Years Over 5 Years
Time Unemployed
Full-Time or Part-Time Employment
(During the Last 30 Days)
15% 26% 23% 10% 37% 38% 90% 63% 62% 85% 74% 77%
1 1 1Bachelors's or Higher Some College/Associates High School or Less
Part-Time Would Rather Be FT Part-Time by Choice Full-Time
Ability to Obtain Suitable Employment
3% 27% 31% 27% 4% 21% 31% 41% 0% 22% 48% 19% 1 1 Excellent Good Fair Poor
High School or Less Some College/Associates Bachelor's or Higher
In 2013, Connecticut women who were full-time wage and salary workers had median weekly earnings of $894
their male counterparts, the U.S.Bureau of Labor Statistics reported. Vermont had the highest female-to-male earnings ratio among the states, 91.3 percent, and Wyoming had the lowest, 68.6 percent. Three of the four counties in Connecticut with employment below 75,000—Litchfield, Tolland, and Windham—had average weekly wages lower than the national average of $1,035, with Windham reporting the lowest, $824.
Median Household Income
$0 $27,500 $55,000 $82,500 $110,000 $137,500
20 40 60 80Lowest Median Income (per census block group)
Putnam Thompson Woodstock Killingly Plainfield Brooklyn Sterling Canterbury Chaplin Ashford Voluntown Hampton Eastford Union Pomfret Scotland
Source: American Fact Finder, U.S. Census Bureau
US Census Bureau 2009-2013 ACS 5-Year EstimatesPutnam makes up 4 of the bottom 5 lowest median incomes Killingly makes up 4 of the bottom 10 lowest median incomes Pomfret’s lowest median income is in the top 10 median incomes for the region, as well as the highest median income overall CT Median
Median Household Income
$49,303 $66,225 $69,461 $53,046
$0 $17,500 $35,000 $52,500 $70,000 $87,500
Villages Region CT US
$34,690 $33,524 $27,528 $27,791 $22,270 $19,652 $41,170 $44,592 $35,644
12500 25000 37500 50000 Region CT US
Median HS Median Less that HS Median
Median Income by Education Level
Median Income by Gender and Education Levels
$27,117 $26,740 $22,245 $45,337 $41,209 $32,888 $31,215 $36,733 $30,182 $49,059 $53,310 $42,016 $23,274 $18,202 $15,235 $34,792 $25,872 $22,676 15000 30000 45000 60000 Region CT US
Female HS Male HS Female Median Male Median Female Less than HS Male Less than HS
Income Level Comparisons
(Does Your Current Job Pay More)
56% 10% 34% 32% 37% 31% 48% 46% 3%
0% 15% 30% 45% 60% More Less The Same
High School or Less Some College/Associates Bachelor's or More
Better or Worse than the Last Generation
46% 41% 7% 52% 33% 14% 57% 33% 5%
0% 15% 30% 45% 60% Better Off Not Better Off The Same
High School or Less Some College/Associates Bachelor's or More
Types of Coverage
5% 13% 15% 15% 66% 7% 23% 16% 12% 59% 9% 41% 25% 6% 35%
1 1
Other Type Medicaid Medicare From Insurance Co. Current Employer Bachelor's or More Some College/Associates High School or Less
Medicaid and Husky A Coverage
21% 21% 21% 20% 31% 29% 34% 21% 19% 13% 11% 12% 12% 17% 18% 19% 14% 13%
0% 10% 20% 30%
Ashford Brooklyn Chaplin Hampton Killingly Plainfield Putnam Sterling Voluntown
Medicaid Husky A
Didn’t Receive or Postponed Needed Care
13% 13% 4% 23% 21% 22%
0% 6% 12% 18% 24% 30% High School or Less Some College/Associates Bachelor's or More
Yes Did Not Get Care Yes Postponed Care
Reasons for Not Receiving or Delaying Care
60% 26% 30% 24% 53% 20% 29% 46% 67% 24% 32% 32%
0% 18% 35% 53% 70% 88% Cost Insurance Not Accepted Insurance Would Not Pay Could not get an Appointment
High School or Less Some College/Associates Bachelor's or More
17% 2% 19% 31% 24% 7% 18% 3% 21% 27% 21% 9%
0% 10% 20% 30% 40%
Spouse Former Spouse BF/GF Live-In/Companion Residing Relative Non-Residing Relative
State Region
Individuals Arrested for Family Violence
694 2,035 424 844 703 324 1,209 921 574 2,749 488 673 748 686 525 407
750 1500 2250 3000
Ashford Brooklyn Canterbury Chaplin Eastford Hampton Killingly Plainfied Pomfret Putnam Scotland Sterling Thompson Union Voluntown Woodstock
Crime Rate (per 100,000)
Late/No Prenatal Care and Low Birth Weight (Percentages)
12% 10% 12% 8% 11% 9% 11% 10% 14% 12% 7% 16% 10% 11%
0% 4% 8% 12% 16% 20%
CT Region Brooklyn Killingly Plainfield Putnam Thompson
Percentage with Late or No Care Low Birth Weight
Child Abuse and/or Neglect Substantiated Cases
(Per 1000)
18.7 15.4 15.9 15.7 16.1 20
0. 5. 10. 15. 20. 25. CT Region Brooklyn Killingly Plainfield Putnam
Teen Births Rate (Per 1,000)
18.8 14.3 15.8 32.1 26.3 30.3
0. 8.5 17. 25.5 34. CT Region Brooklyn Killingly Plainfield Putnam
Births to Teens 15-19
Drug-Induced Deaths 1999-2009, Crude Rate per 100,000
9.6 11.4 11.4 11.4 15.41 10.34 11.11 15.65 18.6 9.3 4.6 18.6 14.8 14.8 14.8 14.8 8.1 26.3 16.2 16.2 18.5 11.1 18.5 18.5
0. 7.5 15. 22.5
1999-2001 2002-2004 2005-2007 2007-2009
CT Region Brooklyn Chaplin Killingly Putnam
State Drug Induced Deaths
355 490 558
150 300 450 600 State 2012 State 2013 State 2014
NECASA: The Community Needs Assessment
Workgroup Priority Rankings Priority Ranking 2012
Priority Ranking 2015
Drugs/Heroin
In 2014 18 people who live in the region died from drug overdoses.
Location Risk Poverty Housing Age Risk Ashford 2 7.42% 16.13 Brooklyn 5 12.57% 23.44 Canterbury 2 4.01% 17.34 Chaplin 5 4.64% 27.67 Eastford 4 2.99% 23.81 Hampton 5 5.91% 27.10 Killingly 4 6.98% 23.84 Dayville 5 9.43% 25.71 Danielson 7 13.11% 29.92 Plainfield (NW) 8 7.42% 16.13 Plainfield (NE) 7 9.63% 33.22 Plainfield (S- RT 14) 5 9.37% 24.28 Pomfret 4 3.11% 23.96 Putnam 4 7.49% 22.64 Putnam SSD 8 10.26% 41.33 Scotland 3 2.52% 22.92 Sterling 4 11.71% 19.84 Thompson (w-395) 6 6.69% 31.56 Thompson (e-395) 5 7.82% 24.13 Union 5 5.04% 26.66 Voluntown 3 2.81% 22.88 Woodstock 3 2.31% 21.39
Lead Risk
Many people with serious mental illness are challenged doubly.
disease.
misconceptions about mental illness. As a result of both, people with mental illness are robbed of the opportunities that define a quality life:
Although research has gone far to understand the impact of the disease, it has
Much work yet needs to be done to fully understand the breadth and scope of prejudice against people with mental illness.
http://www.ncbi.nlm.nih.gov/pmc/articles/PMC1489832/
World Psychiatric Association
Understanding the impact of stigma on people with mental illness
Mental Illness Is Common Of Connecticut’s approximately 3.5 million residents, close to 109,000 adults live with serious mental illness and about 39,000 children live with serious mental health conditions. Untreated Mental Illness has Deadly and Costly Consequences In 2006, 292 Connecticut residents died by suicide. Suicide is almost always the result of untreated or under-treated mental illness. Nationally, we lose one life to suicide every 15.8 minutes. Suicide is the eleventh- leading cause of death overall and is the third-leading cause of death among youth and young adults aged 15-24. During the 2006-07 school year, approximately 32 percent of Connecticut students aged 14 and older living with serious mental health conditions who receive special education services dropped out of high school.
Mental Illness
Mental Illness
Public Mental Health Services are Inadequate to Meet Needs Connecticut’s public mental health system provides services to only 24.5 percent of adults who live with serious mental illnesses in the state. Connecticut spent just $170 per capita on mental health agency services in 2006, or $591.6 million. This was just 2.6 percent of total state spending that year. In 2006, 59 percent of Connecticut state mental health agency spending was on community mental health services; 30 percent was spent on state hospital care. Nationally, an average of 70 percent is spent on community mental health services and 28 percent on state hospital care.
Top 20 Most Frequent Primary Diagnosis
Drove Alone
85% 86% 87% 87% 77% 79% 81% 83% 82% 86% 84% 78% 85% 86% 83% 79% 85% 76% 92% 86% 83% 86% 85% 84% 79% 85% 87% 78% 90% 84% 76% 85%
0% 45% 90% 135% 180% 225%
Ashford Brooklyn Canterbury Chaplin Eastford Hampton Killingly Plainfield Pomfret Putnam Scotland Sterling Thompson Union Voluntown Woodstock 2000 2012
10% 10% 9% 11% 11% 11% 14% 13% 5% 11% 10% 13% 11% 9% 10% 14% 9% 14% 5% 7% 9% 7% 11% 12% 9% 9% 7% 15% 6% 7% 16% 8%
0% 8% 15% 23% 30%
Ashford Brooklyn Canterbury Chaplin Eastford Hampton Killingly Plainfield Pomfret Putnam Scotland Sterling Thompson Union Voluntown Woodstock 2000 2012
Carpooled
Greater Worcester Transit, Webster, MA
Windham Brooklyn Lisb
Jewe tt City Plain field
RIPTA, Scituate, RI SEAT, Jewett City, CT
Regional and Potential Transportation Routes
34,362 38,761 44,771 47,968 48,372 37,516
12,500 25,000 37,500 50,000 62,500
2010 2011 2012 2013 2014 2015
Region
Deviated Fixed Route Service
9.2% increase
1,642 3,263 3,091 2,797 2,828 3,165 5,319
1,500 3,000 4,500 6,000
2009 2010 2011 2012 2013 2014 2015
Elderly/Disabled Door-to-Door Service
224% Increase
Commercial Bus Service
Educational Attainment: 2012
27% 34% 40% 43% 29% 31% 39% 45% 29% 37% 37% 44% 38% 44% 35% 30% 17% 18% 20% 15% 20% 17% 18% 21% 20% 25% 20% 22% 19% 20% 25% 19% 5% 9% 9% 5% 11% 8% 9% 7% 7% 7% 11% 7% 8% 3% 9% 7% 23% 14% 13% 17% 17% 20% 12% 8% 17% 11% 13% 10% 14% 17% 11% 22% 18% 9% 7% 12% 16% 18% 7% 5% 21% 7% 10% 5% 9% 12% 9% 16%
Ashford Brooklyn Canterbury Chaplin Eastford Hampton Killingly Plainfield Pomfret Putnam Scotland Sterling Thompson Union Voluntown Woodstock
High School Graduate Some College, No Degree Associate’s Degree Bachelor’s Degree Graduate or Profesional Degree
Percentage of Persons Without a HS Diploma
14.1 11.1 11.2 16.9 14.6 12.5 11.3 11.1 12.2
0. 4.3 8.5 12.8 17. 21.3
US CT Region Brooklyn Killingly Plainfield Putnam Sterling Thompson
63 36 81 19 79 21
23 45 68 90 Had Needed/Ed Training Needed More Ed/Training
High School or Less Some College/Associates Bachelor's or More
Percentage Employed within the Last 30 Days: Education and Training Needs
60 40 70 30 56 44
18 35 53 70 88 Had Needed Ed/Training Needed More Ed/Training
High School or Less Some College/Associates Bachelor's or More
Percentage Not Employed within the Last 30 Days: Education and Training Needs
Percentage Special Education, Free and Reduced Lunch Graduation Rates
61. 64.7 54.4 72. 75.05 55.74 81. 93.1 85.06
0. 25. 50. 75. 100. US CT Region Special Ed Free/Reduced Lunch No Special Ed
Special Education Population Percentage
8.4 8 12.62
0. 3.3 6.5 9.8 13. 16.3 US CT Region US CT Region
Percentage, Free and Reduced Lunch Rates
49.6 23.15 34.9 42.2 56.9
0. 15. 30. 45. 60. US Region CT Killingly Putnam US Region CT Killingly Putnam
Unable to Buy Food Within the Last Year
18% 14% 5% 31% 19%
HS or Less Some Collge/Associates Bachelor's or More < $30,000/yr $30,000-$75,000
How Often Were You Unable to Purchase Food
12% 9% 9% 40% 58% 22% 48% 66% 69%
1 1 1High School or Lesss Some College/Associates Bachelor's or More Almost Every Month Some Months Only 1 or 2 Months
Next Steps
present to the whole committee
implemented
awarding funds, evaluating programs and their successes
–Robert Kennedy
“Progress is the nice word we like to use. But change is its motivator. And change has its enemies.”
Thank you for your time and input
Questions or Comments