
SLIDE 1
TOWN OF LA LAUREL PARK
BIC ICYCLE & PEDESTRIAN PLA LAN
Ste teering Com
- mmittee Mee
Meeti ting #1 #1 No November 7, 2016
TOWN OF LA LAUREL PARK BIC ICYCLE & PEDESTRIAN PLA LAN Ste - - PowerPoint PPT Presentation
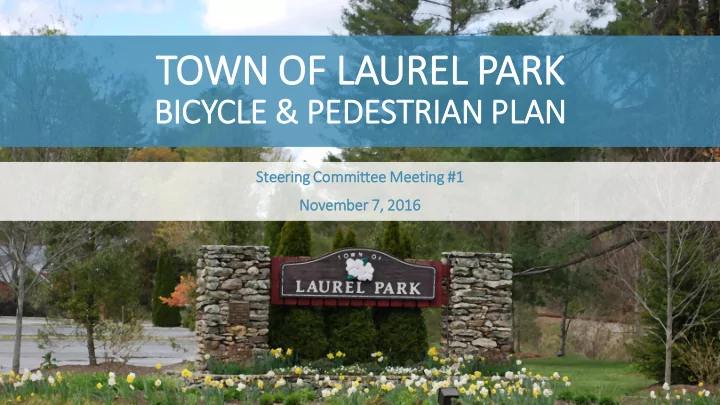
TOWN OF LA LAUREL PARK BIC ICYCLE & PEDESTRIAN PLA LAN Ste teering Com ommittee Mee Meeti ting #1 #1 No November 7, 2016 Reg egio ional l Con ontext xt Obje bjectiv ives Review the planning process Brainstorm words
Ste teering Com
Meeti ting #1 #1 No November 7, 2016
Review the planning process Brainstorm words and phrases for vision statement Discuss the “5 Es” and their relative importance Identify destinations and obstacles Strategize public engagement
Gathe her r Data ta (November to December)
Develop p Recomm mmend ndati tions ns (January to March)
quantitative
Prior
tize Pro rojects ts (April to May)
steering committee
Council for adoption
Cre reate Docume ment (June to September)
0% 10% 20% 30% 40% 50% 60% 70% Under 18 Between 18 and 64 Over 64 Laurel Park Henderson County North Carolina
0% 10% 20% 30% 40% 50% 60% 70% Under 18 Between 18 and 64 Over 64 Laurel Park Hendersonville Flat Rock
0% 2% 4% 6% 8% 10% 12% 14% 16% 18% Below Poverty Line Very Below Poverty Line Laurel Park Henderson County North Carolina
0% 2% 4% 6% 8% 10% 12% 14% 16% 18% Below Poverty Line Very Below Poverty Line Laurel Park Hendersonville Flat Rock
0% 1% 2% 3% 4% 5% No Vehicle Households Laurel Park Hendersonville Flat Rock Henderson County North Carolina
92.1% 0.1% 0.1% 2.1% 5.7%
Henderson County
Drive Transit Bicycle Walk Other 91.6% 1.1% 0.2% 1.8% 5.3%
North Carolina
Drive Transit Bicycle Walk Other 85.3% 0.0% 0.0% 5.6% 9.1%
Laurel Park
Drive Transit Bicycle Walk Other
86.6% 1.1% 1.2% 1.6% 9.4%
Flat Rock
Drive Transit Bicycle Walk Other 89.4% 0.3% 0.1% 7.0% 3.2%
Hendersonville
Drive Transit Bicycle Walk Other 85.3% 0.0% 0.0% 5.6% 9.1%
Laurel Park
Drive Transit Bicycle Walk Other
Engin ineer ering Education En Encouragem ement Enforcemen ent Evalu luatio ion & Pl Plannin ing
Engin ineer ering Education En Encouragem ement Enforcemen ent Evalu luatio ion & Pl Plannin ing
Where are people currently bicycling and walking to/from? Where would they bike/walk if there were fewer obstacles?
What are the geographic and operational barriers to bicycling and walking?
What are some obvious opportunities for improvement?
December
Survey January
House April
Open House Fall 2017
Council Presentation
Draft vision statement, goals, and objectives Schedule next steering committee and first open house Develop and launch interactive map Promote the Bicycle & Pedestrian Plan
Ali Aliso son Meln elnikova Trung Vo, P.E., AICP
Town of Laurel Park Kimley-Horn Town Manager Project Manager amelnikova@laurelpark.org trung.vo@kimley-horn.com 828.693.4840 919.653.2968