total sample n 83
play

Total sample (N) = 83 Questionnaire-based survey applied On-Line - PDF document

1 2 INTRODUCTION 1 2 INTRODUCTION Aims: 1)Knowing the importance which older people attribute to different barriers to their mobility on foot. 2)Knowing what are the technological aids more proper for each of these barriers. 3 3 METHOD:


  1. 1 2 INTRODUCTION 1 2 INTRODUCTION Aims: 1)Knowing the importance which older people attribute to different barriers to their mobility on foot. 2)Knowing what are the technological aids more proper for each of these barriers. 3 3 METHOD: characteristics of this study METHOD: characteristics of this study 4 4 
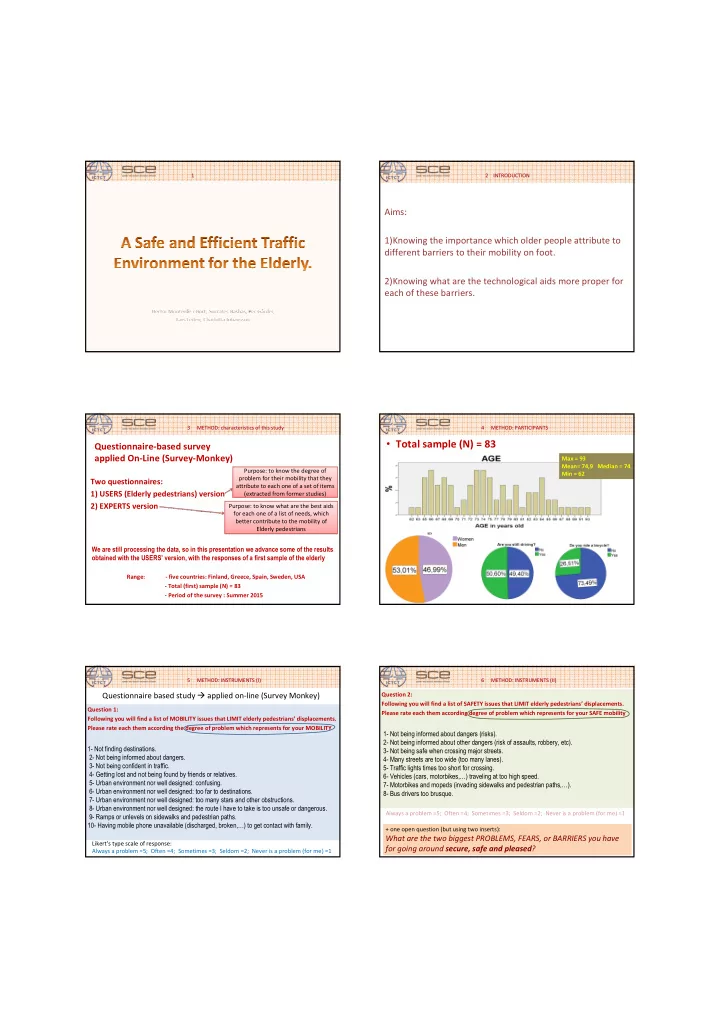
METHOD: PARTICIPANTS METHOD: PARTICIPANTS • Total sample (N) = 83 Questionnaire-based survey applied On-Line (Survey-Monkey) Max = 93 Mean= 74,9 Median = 74 Purpose: to know the degree of Purpose: to know the degree of Min = 62 problem for their mobility that they problem for their mobility that they Two questionnaires: attribute to each one of a set of items attribute to each one of a set of items 1) USERS (Elderly pedestrians) version (extracted from former studies) (extracted from former studies) 2) EXPERTS version Purpose: to know what are the best aids Purpose: to know what are the best aids for each one of a list of needs, which for each one of a list of needs, which better contribute to the mobility of better contribute to the mobility of Elderly pedestrians Elderly pedestrians We are still processing the data, so in this presentation we advance some of the results obtained with the USERS’ version, with the responses of a first sample of the elderly Range: - five countries: Finland, Greece, Spain, Sweden, USA - Total (first) sample (N) = 83 - Period of the survey : Summer 2015 5 5 METHOD: INSTRUMENTS (I) METHOD: INSTRUMENTS (I) 6 6 METHOD: INSTRUMENTS (II) METHOD: INSTRUMENTS (II) Questionnaire based study � applied on-line (Survey Monkey) Question 2: Following you will find a list of SAFETY issues that LIMIT elderly pedestrians’ displacements. Question 1: Please rate each them according degree of problem which represents for your SAFE mobility Following you will find a list of MOBILITY issues that LIMIT elderly pedestrians’ displacements. Please rate each them according the degree of problem which represents for your MOBILITY 1- Not being informed about dangers (risks). 2- Not being informed about other dangers (risk of assaults, robbery, etc). 1- Not finding destinations. 3- Not being safe when crossing major streets. 2- Not being informed about dangers. 4- Many streets are too wide (too many lanes). 3- Not being confident in traffic. 5- Traffic lights times too short for crossing. 4- Getting lost and not being found by friends or relatives. 6- Vehicles (cars, motorbikes,…) traveling at too high speed. 5- Urban environment nor well designed: confusing. 7- Motorbikes and mopeds (invading sidewalks and pedestrian paths,…). 6- Urban environment nor well designed: too far to destinations. 8- Bus drivers too brusque. 7- Urban environment nor well designed: too many stars and other obstructions. 8- Urban environment nor well designed: the route I have to take is too unsafe or dangerous. Always a problem =5; Often =4; Sometimes =3; Seldom =2; Never is a problem (for me) =1 9- Ramps or unlevels on sidewalks and pedestrian paths. 10- Having mobile phone unavailable (discharged, broken,…) to get contact with family. + one open question (but using two inserts): What are the two biggest PROBLEMS, FEARS, or BARRIERS you have Likert’s type scale of response: for going around secure, safe and pleased ? Always a problem =5; Often =4; Sometimes =3; Seldom =2; Never is a problem (for me) =1

  2. 8 8 Mobility issues that limit elderly pedestrians’ ’ movements movements Mobility issues that limit elderly pedestrians 7 7 RESULTS RESULTS % S S T L T U L U S E S R E R ) ) e e c c n a n a v v d d a ( a ( 10 10 Mobility issues that limit elderly pedestrians’ Mobility issues that limit elderly pedestrians ’ movements movements 9 9 Mobility issues that limit elderly pedestrians Mobility issues that limit elderly pedestrians’ ’ movements movements % % % % % 11 11 Mobility issues that limit elderly pedestrians Mobility issues that limit elderly pedestrians’ ’ movements movements 12 12 Safety issues that limit elderly pedestrians Safety issues that limit elderly pedestrians’ ’ movements movements % % % %

  3. 13 13 Safety issues that limit elderly pedestrians Safety issues that limit elderly pedestrians’ ’ movements movements 14 14 Safety issues that limit elderly pedestrians Safety issues that limit elderly pedestrians’ ’ movements movements % % % % % 15 15 Safety issues that limit elderly pedestrians Safety issues that limit elderly pedestrians’ ’ movements movements 16 16 Statistical differences by GENDER Statistical differences by GENDER M–W U test (women - men) Statistically significant differences in (this issues): Mobility issues that limit elderly pedestrians’ movements Issues: p value Comments Women rated stat.sign. Not feeling confident in traffic 0,000 higher than men (bigger problem/barrier) % Urban environment not well designed: 0,010 Idem women too many stairs and other obstructions Safety issues that limit elderly pedestrians’ movements 0.011 Idem women Traffic light times too short for crossing Bus drivers too brusque (abrupt halts, 0.047 Idem women starts, spins, …) Note: no statistically differences in the rest of issues (studied) Statistical correlation issues with Age 17 17 Statistical correlation issues with Age 18 Conclusions 18 Conclusions Pearson Correlation to Age Distribution per country: uneven Statistically significant correlations with (this issues): Correlation between age/gender and variables: Issues: p value Comments Mobility issues that limit elderly pedestrians’ movements Comparison is made between old people to other slightly less old people. Comparison with young people may lead to Stat.sign. direct relation different results. 0,025 More aged = more rated Not feeling confident in traffic* (bigger problem/barrier) Getting very old means that a person: Urban environment not well designed: Stat.sign. direct relation � feels [statistically significant] less confident 0,006 Idem aged too many stairs and other obstructions* � has problems with "Urban environment not being well designed: too many stairs and other obstructions“ Ramps or unleveled parts on sidewalks Stat.sign. direct relation 0,041 � has issues with "ramps or unleveled parts on sidewalks and Idem aged and pedestrian paths pedestrian paths“ Safety issues that limit elderly pedestrians’ movements � not being safe when crossing major streets. Not being safe when crossing major Stat.sign. direct relation 0.041 Idem aged streets Almost statistically significant issues were also "too short walk Note: no statistically significant correlations between AGE and the rest of issues. phases at signals" and "bicycles on sidewalks". *the two first appear in both analysis: relevant for gender and relevant for age .

  4. Conclusions Conclusions 19 19 Conclusions Conclusions 20 20 Stronger opinion (Women) Stronger opinion (Men) Women: Mobility issues that limit elderly pedestrians’ movements Not finding destinations Urban environment not well designed: confusing � feel much less confident in traffic than men Not being informed about dangers Having mobile phone unavailable (discharged, � think that the urban environment is not well designed with too broken,...) to get contact with family Getting lost and not being found by friends or relatives Not having a phone with GPS (guidance facilities) many stairs and other obstructions � walk phases are too short Urban environment not well designed: too long distance to my needed destinations (health centre, apotheke, bus stop, grocery, etc.) Urban environment not well designed: the route I have to take is too unsafe or dangerous Ramps or unleveled parts on sidewalks and pedestrian paths Safety issues that limit elderly pedestrians’ movements Not being informed about other dangers (risks of assault, robbery, etc.) Not being informed about dangers (risks) in traffic Not being safe when crossing major streets Many streets are too wide (too many lanes) Vehicles (cars, motorbikes, ...) traveling at too high speeds Motorbikes and mopeds (invading sidewalks and pedestrian paths, ...) Bicycles riding on pedestrian paths (sidewalks, crossings, ...) Bus drivers being too brusque (abrupt halts, starts, spins, ...) 21 21 End End Thank you for your attention

Download Presentation
Download Policy: The content available on the website is offered to you 'AS IS' for your personal information and use only. It cannot be commercialized, licensed, or distributed on other websites without prior consent from the author. To download a presentation, simply click this link. If you encounter any difficulties during the download process, it's possible that the publisher has removed the file from their server.

Recommend


More recommend