
SLIDE 1
April 2012 Benjamin Tal
Tortoise Race
|
2
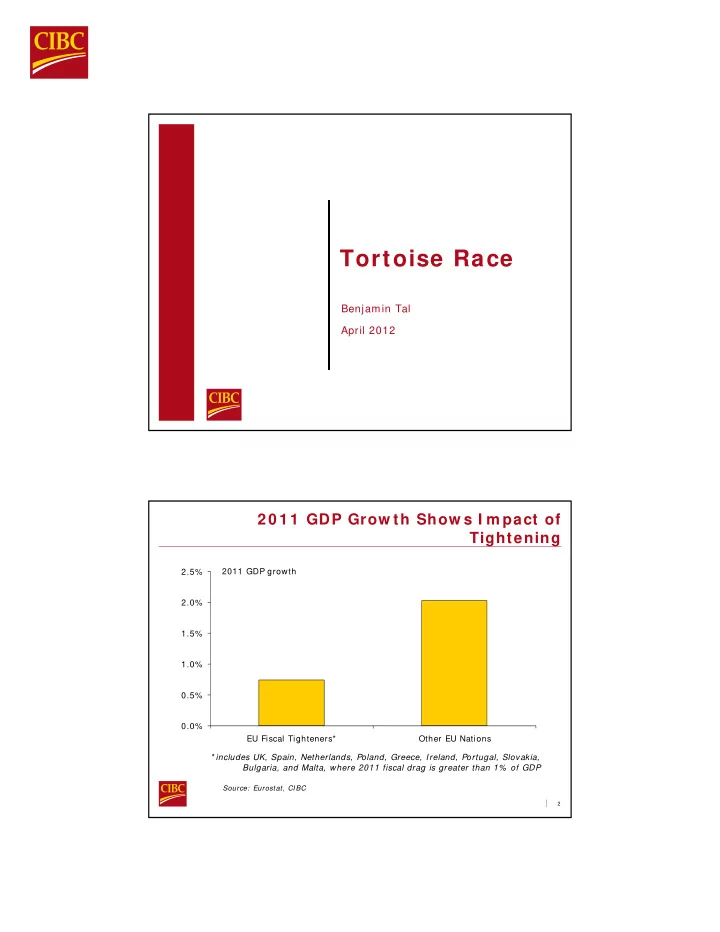
2 0 1 1 GDP Grow th Show s I m pact of Tightening
0.0% 0.5% 1.0% 1.5% 2.0% 2.5% EU Fiscal Tighteners* Other EU Nations 2011 GDP growth * includes UK, Spain, Netherlands, Poland, Greece, Ireland, Portugal, Slovakia, Bulgaria, and Malta, where 2011 fiscal drag is greater than 1% of GDP
Source: Eurostat, CIBC