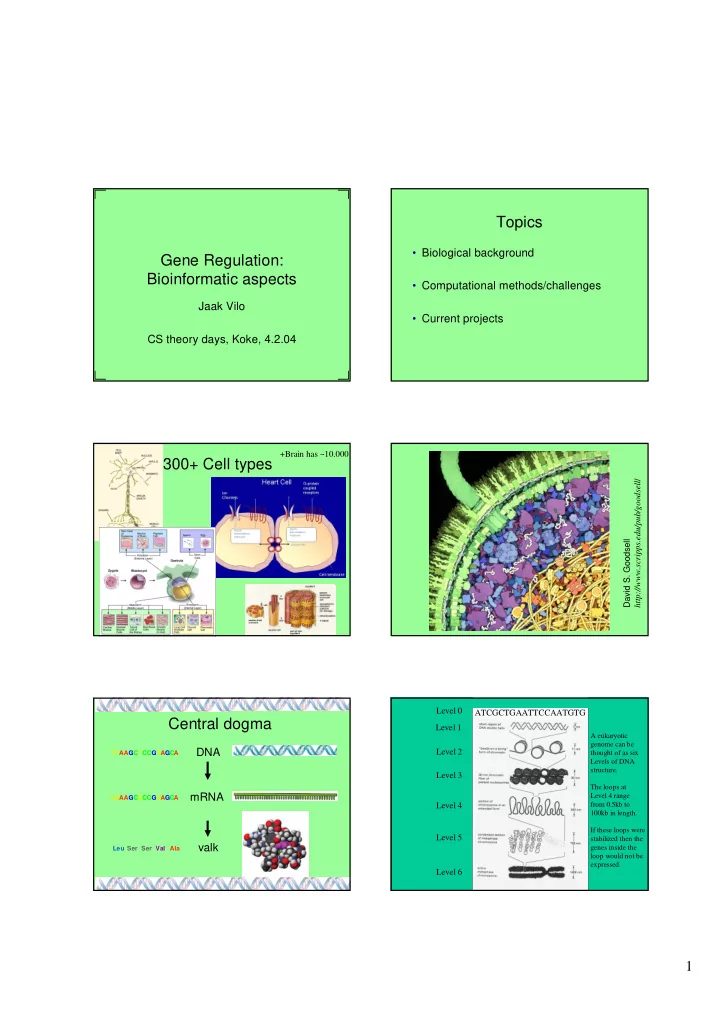
Topics Biological background Gene Regulation: Bioinformatic - - PDF document

topics
SMART_READER_LITE
LIVE PREVIEW

Topics Biological background Gene Regulation: Bioinformatic - - PDF document

Topics Biological background Gene Regulation: Bioinformatic aspects Computational methods/challenges Jaak Vilo Current projects CS theory days, Koke, 4.2.04 +Brain has ~10.000 300+ Cell types http://www.scripps.edu/pub/goodsell


slide-1
SLIDE 1

1

Gene Regulation: Bioinformatic aspects

Jaak Vilo CS theory days, Koke, 4.2.04

Topics

  • Biological background
  • Computational methods/challenges
  • Current projects

300+ Cell types

+Brain has ~10.000 David S. Goodsell http://www.scripps.edu/pub/goodsell/

Central dogma

AA A A C C C G G G T T T T

DNA valk mRNA

C AA A A C C C G G G U U U U C Leu Ser Ser Val Ala

Level 1 Level 2 Level 3 Level 4 Level 5 Level 6

A eukaryotic genome can be thought of as six Levels of DNA structure. The loops at Level 4 range from 0.5kb to 100kb in length. If these loops were stabilized then the genes inside the loop would not be expressed.

Level 0 ATCGCTGAATTCCAATGTG

slide-2
SLIDE 2

2

DNA

GenBank / EMBL Bank

Protein

SwissProt/TrEMBL

Structure

PDB/Molecular Structure Database

DNA determines function (?)

4 Nucleotides 20+ Amino Acids

(3nt 1 AA)

Function?

✂✁☎✄☎✆ ✝✟✞ ✠✟✡ ☛✟✡✌☞✟✝✎✍ ✏ ✑ ✒ ✓✕✔ ✖ ✗ ✓ ✘ ✙ ✚ ✘ ✑ ✛ ✜ ✢ ✖ ✗ ✣ ✓ ✘ ✛ ✤

A Simple Metabolic Pathway

Shoshanna Wodak, Jacques van Helden

A Simple Gene

ATCGAAAT TAGCTTTA

✥✌✦ ✧ ✦ ★✌✩✕✪ ✫✌✬ ✭ ✬ ✮ ✯ ✰ ✬ ✪✌✱ ✲

Upstream/ promoter Downstream

DNA:

✳✌✦

F.C.P. Holstege, E.G. Jenning, J.J. Wyrick, Tong Ihn Lee, C.J. Hengartner, M.R. Green, T.R. Golub, E.S. Lander, and R.A. Young Dissecting the Regulatory Circuitry of a Eukaryotic Genome

Cell 95: 717-728 (1998) Model of RNA Polymerase II Transcription Initiation

  • Machinery. The machinery

depicted here encompasses over 85 polypeptides in ten (sub) complexes: core RNA polymerase II (RNAPII) consists of 12 subunits; TFIIH, 9 subunits; TFIIE, 2 subunits; TFIIF, 3 subunits; TFIIB, 1 subunit, TFIID, 14 subunits; core SRB/mediator, more than 16 subunits; Swi/Snf complex, 11 subunits; Srb10 kinase complex, 4 subunits; and SAGA, 13 subunits.

Regulation of gene expression (transcription)

Gene regulation

  • Determines
  • the development (from embryo)
  • cell types
  • processes of the cell
  • response to the environment
  • Regulation happens at different levels
slide-3
SLIDE 3

3 Regulation by binding to DNA/RNA

4^6= 4096, 4^8=65.000

Regulation of splicing

Valgu seondumine võib mõjutada splaissingut 80 % 15 % 5 %

Regulation of Alternative Splicing

  • Which splice variants in which cells?
  • Are there cell type specific splicing

regulators and signals in DNA/RNA?

  • Find genes that have an exon switched
  • n specifically in tissue X
  • Is there a common signal for all such

exons or splicing events?

Tissue specific alternative splicing

EST-tehnoloogial baseeruvad andmed (Meelis Kull)

7 1 1 1 2 1 1 V3 32 8 4 6 2 2 2 1 7 V2 76 18 7 17 3 4 2 5 3 1 16 V1 Geen 3 4 2 1 1 V6 2 1 1 V5 8 2 1 2 1 2 V4 4 1 1 1 1 V3 19 4 7 2 3 3 V2 46 12 3 11 2 1 1 4 3 1 8 V1 Geen 2 4 3 1 V5 3 1 1 1 V4 9 1 1 1 2 1 3 V3 38 9 4 9 2 2 3 3 1 5 V2 15 6 1 2 1 3 1 1 V1 Geen 1 sum T10 T9 T8 T7 T6 T5 T4 T3 T2 T1

How to study the gene regulation with computational methods?

  • What data is available?
  • How to combine them meaningfully?
  • Algorithms (is the analysis feasible)?
  • Actual analysis
  • Interpret the results

Core data (Static)

  • DNA sequence(s)
  • Genes
  • Protein sequences
  • Relation to other species
  • Protein structure (???)
  • Partial knowledge about function
  • how to capture this formally?
slide-4
SLIDE 4

4 Phylogenetic tree

www.tolweb.org

Expression data (dynamics)

  • Low-throughput methods
  • Expressed Sequence Tags (EST)
  • RNA sequences
  • DNA microarrays for gene expression
  • Relative abundance of RNA in cell
  • Genome-wide localization studies
  • binding of proteins to DNA
  • Proteomics
  • Amount of proteins in cells

Veel pole piisavalt informatsiooni:

  • Alternatiivne splaissing
  • Valkude modifikatsioonid
  • RNA geenid, lühikesed geenid, …
  • geenide regulatsioon ja võrgustikud
  • DNA ja RNA struktuur ja nende mõjud
  • Valkude struktuur ja täpne funktsioon ning

roll bioloogilistes protsessides

  • metaboolsed ja signaali ülekande rajad
  • Variatsioonid populatsioonis
  • Rääkimata selle kõige arvesse võtmisest
  • rganismi tasemel…

Study of sequence features

Is there something unique in the promoter regions?

Study of sequence features

a) b) random (other regions) Promoters vs. background

slide-5
SLIDE 5

5

Upstream vs genomic random Phylogenetic footprinting

human ape mouse fish chicken …

If preserved during evolution then must be important for something!!!

Study the same gene in many species

Similar function or role same regulation?

  • This may or may not be true
  • How do we actually know that they are

behaving similarly?

  • Different regulation mechanisms may

achieve the same effect Proteasome: GGTGGCAAA Proteasome: -1:GGTGGCAAA Proteasome: -2:GGTGGCAAA

slide-6
SLIDE 6

6

Proteasome: -3:GGTGGCAAA

Proteasome movie

  • Movies\proteasome.wmv
  • 1: ..[AG][AG][AG]CAGTCAC[AG]..

Homol-D 121 vs 249

Probability < 1e-117

  • 1: ..[AG]CCCTA[CA]CCT..

Homol-E 58 vs. 159

  • S. Pombe GO+genome

Cytosolic Ribosome

187 vs. 4897 genes in total ATG W C

Dynamics?

  • Which genes regulate others
  • When and how genes are ‘switched on
  • r off?’
  • What is the global relationship between

genes

  • How to model the gene regulation?
  • Continuous stochastic processes

responding to the external stimuli

Experimental data?

  • What data can we start with?
  • What is known or hypothesised so far?
  • Can one test the new hypotheses in

practice?

slide-7
SLIDE 7

7

LASER, scanning

culture 1 culture 2

mRNA cDNA hybridise

DB Analysis of biological samples with microarrays TIGR 32k Human Arrays TIGR 32k Human Arrays

From microarray images to gene expression data

Raw data

Array scans Image quantifications

Spots Spot/Image quantiations

Intermediate data

Samples

Genes Gene expression levels

Final data

Eisen et.al, PNAS 98 Spellman et.al. Mol Biol Cell 98

Golub et al, Science Oct 15th 1999

  • 38 samples of acute

myeloic leukemia (AML) and acute lymphoblastic leukemia (ALL)

  • 6817 genes
  • classificator built based on

50 best correlated genes

  • tested on 34 new samples,

29 of them predicted accurately

ALL AML ALL AML

Tumor classification: 1) class prediction 2) class discovery

Hughes, T. R. et al: “Functional Discovery via a Compendium

  • f Expression Profiles”, Cell 102 (2000), 109-126.
slide-8
SLIDE 8

8

Gene expression data

  • Snapshots in time to various stimuli,

conditions, tissues, time,

  • Approximate information about the level
  • f gene expression (RNA transcripts)
  • Limited granularity of time
  • Limited accuracy
  • Data size is large => need fast methods
  • Algorithm: Meelis Kull and J.V.

Cluster of co-expressed genes, pattern discovery in regulatory regions

✁✄✂ ☎ ✆ ✝ ✞ ☎ ✟ ✠ ✆ ✡ ☛ ☞ ✌ ✍ ✎ ✎ ✏ ✑ ✒ ☞ ✌ ✑ ✓ ✏ ✔ ✍ ✎ ✕ ✖ ✗ ✘ ✙ ✚ ✛ ✜✢✙ ✚ ✣ ✤ ✥ ✦ ✗ ✧ ✝ ★ ✠ ✟ ✝ ✩ ✝ ✪ ✫ ✬ ✭✯✮ ✰ ✱ ✱ ✲ ✳ ✬ ✴✶✵ ✷ ✲ ✳ ✸ ✳ ✲ ✮ ✳ ✲ ✴ ✲ ✬ ✱ ✲ ✭✺✹✶✫ ✱ ✻ ✫ ✬✽✼ ✾ ✿ ✴ ✱ ✲ ✳

Genome Research 1998; ISMB (Intelligent Systems in Mol. Biol.) 2000

Pattern selection criteria Binomial distribution

5 out of 25, p = 0.2

Background - ALL upstream sequences Cluster: π

π π π occurs 3 times

P(3,6,0.2) is probability

  • f having ≥3 matches

in 6 sequences

P(π π π π,3,6,0.2) =0.0989

The most unprobable pattern from best clusters

Pattern Probability Cluster Occurrences Total nr of K size in cluster

  • ccurrences

in K-means AAAATTTT 2.59E-43 96 72 830 60 ACGCG 6.41E-39 96 75 1088 50 ACGCGT 5.23E-38 94 52 387 40 CCTCGACTAA 5.43E-38 27 18 23 220 GACGCG 7.89E-31 86 40 284 38 TTTCGAAACTTACAAAAAT 2.08E-29 26 14 18 450 TTCTTGTCAAAAAGC 2.08E-29 26 14 18 325 ACATACTATTGTTAAT 3.81E-28 22 13 18 280 GATGAGATG 5.60E-28 68 24 83 84 TGTTTATATTGATGGA 1.90E-27 24 13 18 220 GATGGATTTCTTGTCAAAA 5.04E-27 18 12 18 500 TATAAATAGAGC 1.51E-26 27 13 18 300 GATTTCTTGTCAAA 3.40E-26 20 12 18 700 GATGGATTTCTTG 3.40E-26 20 12 18 875 GGTGGCAA 4.18E-26 40 20 96 180 TTCTTGTCAAAAAGCA 5.10E-26 29 13 18 250 CGAAACTTACAAA 5.10E-26 29 13 18 290 GAAACTTACAAAAATAAA 7.92E-26 21 12 18 650 TTTGTTTATATTG 1.74E-25 22 12 18 600 ATCAACATACTATTGT 3.62E-25 23 12 18 375 ATCAACATACTATTGTTA 3.62E-25 23 12 18 625 GAACGCGCG 4.47E-25 20 11 13 260 GTTAATTTCGAAAC 7.23E-25 24 12 18 400 GGTGGCAAAA 3.37E-24 33 14 31 475 ATCTTTTGTTTATATTGA 7.19E-24 19 11 18 675 TTTGTTTATATTGATGGA 7.19E-24 19 11 18 475 GTGGCAAA 1.14E-23 28 18 137 725

Vilo et.al. ISMB 2000

Significance of the patterns

The pattern probability vs. the average silhouette for the cluster The same for randomised clusters

Vilo et.al. ISMB 2000

slide-9
SLIDE 9

9

>YAL036C chromo=1 coord =(76154-75048(C )) start=-600 en d=+2 seq=(76152- 76754) TGTTCTTTCTTCTTCTGCTTCTCCTTTTCCTTTTTTTCCTTCTCCTTTTCCTTCTTGGACTTTAGTATAGGCTTACCATCCTTCTTCTCTTCAATAACCTTCTTTTCTTG CTTCTTCTTCGATTGCTTCAAAGTAGACATGAAGTCGCCTTCAATGGCCTCAGCACCTTCAGCACTTGCACTTGCTTCTCTGGAAGTGTCATCTGCACCTGCGCTGCTTT CTGGATTTGGAGTTGGCGTGGCACTGATTTCTTCGTTCTGGGCGGCGTCTTCTTCGAATTCCTCATCCCAGTAGTTCTGTTGGTTCTTTTTACTCTTTTTCGCCATCTTT CACTTATCTGATGTTCCTGATTGCCCTTCTTATCCCCTCAAAGTTCACCTTTGCCACTTATTCTAGTGCAAGATCTCTTGCTTTCAATGGGCTTAAAGCTTGAAAAATTT TTTCACATCACAAGCGACGAGGGCCCGTTTTTTTCATCGATGAGCTATAAGAGTTTTCCACTTTTAAGATGGGATATTACGGTGTGATGAGGGCGCAATGATAGGAAGTG TTTGAAGCTAGATGCAGTAGGTGCAAGCGTAGAGTTGTTGATTGAGCAAA_ATG_ >YAL025C chromo=1 coord=(101147-100230(C)) start=-600 end=+2 seq=(101145-101747) CTTAGAAGATAAAGTAGTGAATTACAATAAATTCGATACGAACGTTCAAATAGTCAAGAATTTCATTCAAAGGGTTCAATGGTCCAAGTTTTACACTTTCAAAGTTAACC ACGAATTGCTGAGTAAGTGTGTTTATATTAGCACATTAACACAAGAAGAGATTAATGAACTATCCACATGAGGTATTGTGCCACTTTCCTCCAGTTCCCAAATTCCTCTT GTAAAAAACTTTGCATATAAAATATACAGATGGAGCATATATAGATGGAGCATACATACATGTTTTTTTTTTTTTAAAAACATGGACTCGAACAGAATAAAAGAATTTAT AATGATAGATAATGCATACTTCAATAAGAGAGAATACTTGTTTTTAAATGAGAATTGCTTTCATTAGCTCATTATGTTCAGATTATCAAAATGCAGTAGGGTAATAAACC TTTTTTTTTTTTTTTTTTTTTTTTGAAAAATTTTCCGATGAGCTTTTGAAAAAAAATGAAAAAGTGATTGGTATAGAGGCAGATATTGCATTGCTTAGTTCTTTCTTTTG ACAGTGTTCTCTTCAGTACATAACTACAACGGTTAGAATACAACGAGGAT_ATG_

...

>YBR084W chromo=2 coord=(411012-413936) start=-600 end=+2 seq=(410412-411014) CCATGTATCCAAGACCTGCTGAAGATGCTTACAATGCCAATTATATTCAAGGTCTGCCCCAGTACCAAACATCTTATTTTTCGCAGCTGTTATTATCATCACCCCAGCAT TACGAACATTCTCCACATCAAAGGAACTTTACGCCATCCAACCAATCGCATGGGAACTTTTATTAAATGTCTACATACATACATACATCTCGTACATAAATACGCATACG TATCTTCGTAGTAAGAACCGTCACAGATATGATTGAGCACGGTACAATTATGTATTAGTCAAACATTACCAGTTCTCGAACAAAACCAAAGCTACTCCTGCAACACTCTT CTATCGCACATGTATGGTTCTTATTGTTTCCCGAGTTCTTTTTTACTGACGCGCCAGAACGAGTAAGAAAGTTCTCTAGCGCCATGCTGAAATTTTTTTCACTTCAACGG ACAGCGATTTTTTTTCTTTTTCCTCCGAAATAATGTTGCAGCGGTTCTCGATGCCTCAAGAATTGCAGAAGTAAACCAGCCAATACACATCAAAAAACAACTTTCATTAC TGTGATTCTCTCAGTCTGTTCATTTGTCAGATATTTAAGGCTAAAAGGAA_ATG_

101 Sequences relative to ORF start

GATGAG.T 1:52/70 2:453/508 R:7.52345 BP:1.02391e-33 G.GATGAG.T 1:39/49 2:193/222 R:13.244 BP:2.49026e-33 AAAATTTT 1:63/77 2:833/911 R:4.95687 BP:5.02807e-32 TGAAAA.TTT 1:45/53 2:333/350 R:8.85687 BP:1.69905e-31 TG.AAA.TTT 1:53/61 2:538/570 R:6.45662 BP:3.24836e-31 TG.AAA.TTTT 1:40/43 2:254/260 R:10.3214 BP:3.84624e-30 TGAAA..TTT 1:54/65 2:608/645 R:5.82106 BP:1.0887e-29 ...

GATGAG.T TGAAA..TTT

YGR128C + 100

Upstream sequence (600bp)

GATGAG.T TGAAA..TTT

GATGAG.T W/30 TGAAA..TTT 1 mismatch

Problems

  • Many motifs are statistically significant
  • Many of them similar to each other
  • Summarize meaningfully!
  • Create probabilistic models
  • Algorithms: J.V. and Triinu Tasa

Annotation of clusters

  • Map gene sets to GeneOntology categories.

GO:0042254 <U:L> Process: ribosome biogenesis and assembly (+2:15) (depth=7) [sgd:2:187] GO:0042254: 47 from cluster (size 98) vs 187 in this class (including subclasses) GO:0006364 <U:L> Process: rRNAprocessing (+3:3) (depth=8) [sgd:50:126] GO:0006364: 35 from cluster (size 98) vs 126 in this class (including subclasses) GO:0006360 <U:L> Process: transcription from Pol I promoter (+6:14) (depth=8) [sgd:23:155] GO:0006360: 38 from cluster (size 98) vs 155 in this class (including subclasses) GO:0005730 <U:L> Component: nucleolus (+10:17) (depth=6) [sgd:154:210] GO:0005730: 45 from cluster (size 98) vs 210 in this class (including subclasses) GO:0030515 <U:L> Function: snoRNA binding (depth=6) [sgd:23:23] GO:0030515: 17 from cluster (size 98) vs 23 in this class (including subclasses) GO:0030490 <U:L> Process: processing of 20S pre-rRNA(depth=9) [sgd:33:33] GO:0030490: 18 from cluster (size 98) vs 33 in this class (including subclasses) GO:0005732 <U:L> Component: small nucleolar ribonucleoprotein complex (depth=6) [sgd:30:30] GO:0005732: 16 from cluster (size 98) vs 30 in this class (including subclasses) GO:0006396 <U:L> Process: RNA processing (+7:52) (depth=7) [sgd:7:370] GO:0006396: 40 from cluster (size 98) vs 370 in this class (including subclasses)

  • Algorithms: J.V. and Jüri Reimand

Sequence + Motifs + Expression data -- combined view

Pattern Discovery

  • 1. Choose the language (formalism)

to represent the patterns

  • 2. Choose the rating for patterns, to tell

that one pattern is “better” than other

  • 3. Design an algorithm that finds the

best patterns from the pattern class,

fast.

slide-10
SLIDE 10

10

Patterns: AT

Patterns: WHAT ([AT][ACT]AT)

SPEXS - Sequence Pattern EXhaustive Search

Jaak Vilo, 1998

  • User-definable pattern language: substrings, character

groups, wildcards, flexible wildcards (c.f. PROSITE)

  • Fast exhaustive search over pattern language
  • “Lazy suffix tree construction”-like algorithm
  • Analyze multiple sets of sequences simultaneously
  • Restrict search to most frequent patterns only (in each set)
  • Report most frequent patterns, patterns over- or

underrepresented in selected subsets, or patterns significant by various statistical criteria, e.g. by binomial distribution

Regular patterns

  • Substrings

ATCGA

  • Add groups

ATC[GC][AT]

  • Add (unrestricted) wildcards AT*CG
  • Add restricted wildcards AT*(2,5)CG
  • Combine all above

AT[GC]*(1,3)[GT]AC TGC…………GCA

SPEXS: pattern discovery based on pattern trie.

  • Substrings
  • Group characters
  • Wildcard positions
  • Variable length wildcards
  • Restrictions on the number on

each separately

  • At least k occurrences
  • Exact occurrences locations

for each pattern

A T {1,3,5,7} {2,6,8} [CT] C ∪

∪ ∪ ∪ T

*A {3,5,7} {2,4,6,8}

ATACATAT$ 123456789 Vilo 1998

SPEXS: specify the pattern language and

parameters for pattern discovery

Sequences Background Pattern frequency Pattern language “Fitness” Search order

slide-11
SLIDE 11

11

How to improve?

  • Simple vs complex patterns/profiles
  • What is the best representation?
  • What is the best algorithmic approach
  • Can we prove/disprove expression data

clustering methods or distance measures by systematic promoter analysis?

  • Lots of computations to perform…
  • Tools for non-algorithm persons - how to

maintain the simplicity vs desired results vs computational complexity

Implant k,d-patterns

(The Challenge Problem, P.Pevzner, 2000)

TGTTCTTTCTTCTTTCATACATCCTTTTCCTTTTTTTCC TTCTCCTTTCATTTCCTGACTTTTAATATAGGCTTACCA TCCTTCTTCTCTTCAATAACCTTCTTACATTGCTTCTTC TTCGATTGCTTCAAAGTAGTTCGTGAATCATCCTTCAAT GCCTCAGCACCTTCAGCACTTGCACTTCATTCTCTGGAA GTGCTGCACCTGCGCTGTCTTGCTAATGGATTTGGAGTT GGCGTGGCACTGATTTCTTCGACATGGGCGGCGTCTTCT TCGAATTCCATCAGTCCTCATAGTTCTGTTGGTTCTTTT CTCTGATGATCGTCATCTTTCACTGATCTGATGTTCCTG TGCCCTATCTATATCATCTCAAAGTTCACCTTTGCCACT TTCCAAGATCTCTCATTCATAATGGGCTTAAAGCCGTAC TTTTTTCACTCGATGAGCTATAAGAGTTTTCCACTTTTA GATCGTGGCTGGGCTTATATTACGGTGTGATGAGGGCGC TTGAAAAGATTTTTTCATCTCACAAGCGACGAGGGCCCG

Length k=15 TGATTTCTTCGACAT d=4, nr of changed characters TGTTATCTTGGAGAT TGAATTGTTCCACAC Such motifs can differ in up to 8 positions out of 15!

Approximate all against all

  • Assume at least one perfect occurrence

exists

  • Only O(kn) different substrings of length k
  • Match all of them approximately
  • Find the one that has most significant nr of

approximate occurrences

  • Trie-index the sequences first, then search
  • Algorithm: J.V. and Hendrik Nigul

Gene regulation is affected by

  • DNA/RNA sequence
  • signals along that sequence
  • DNA structure and state
  • State of the cell
  • i.e. all the other molecules and
  • Environment

Binding sites: individually and in combination

Episode rules: A followed by (C D or D C) Asko Tiidumaa Conservation of distances between sites Jelena Zaitseva

X

Goals:

Given the sequence (signals) and gene expression levels of other genes: predict expression level of gene X

X

Given the chromosomal sequence predict locations of promoters and genes Predict dependencies between all genes, and study gene regulation networks

slide-12
SLIDE 12

12

✂ ✄☎✂ ✆ ✝ ✁ ✞ ✂ ✟ ✠ ✡ ☛✌☞ ✍✏✎ ✑ ✒ ✓ ✒✏✔✕✑ ✒ ✓ ✒ ✖✗✑ ✒ ✓ ✒ ✘✙✑ ✒ ✓ ✒ ✚ ✛ ✓ ✜ ✢ ✣ ✤ ✥ ✦ ✧ ✣ ★ ✩ ✢ ★ ✪ ✥ ✫ ✤ ✧ ✢ ✪ ✣ ✦

G1 G2 G4 G3

Gene regulation by transcription factors

lacZ ... Promoter Operator Repressor lacI Promoter Activator Glucose Lactose Glucose Galactose + Galactosidase

Lac-Operon

Thomas Schlitt

Boolean networks

Synchronous Boolean networks - assumptions in gene network modelling

  • Each gene the system (cell) can be in one of

two states –

  • ‘expressed’ – 1,
  • ‘not expressed’ – 0
  • The genes can switch from state to state all

simultaneously in synchronous manner

  • The next state of each gene is determined by

previous states of all genes by Boolean functions describing the network

000 001 010 011 111 101 110 100

State space Finite state linear model

&

¬ ¬ ¬ ¬

ri=(-1.5, 0.5) Fi

B2 B1 B3

slide-13
SLIDE 13

13

&

¬ ¬ ¬ ¬

Fi

B2 1 B1 1 B3 0

ri=(-1.5, 0.5)

&

¬ ¬ ¬ ¬

ri=(-1.5, 0.5) Fi

B2 1

1

B1 1 B3 0

&

Fi

B2 1

1 ci t

B1 1 B3 0

¬ ¬ ¬ ¬

&

¬ ¬ ¬ ¬

Fi

B2 1

ci t

B1 1 B3 1

lacZ ... Promoter Operator Repressor lacI Promoter Activator Glucose Lactose Glucose Galactose + Galactosidase repressor repressor galactose activator glucose activator see table galactosidase galactosidase repressor activator galactosidase & & glucose galactose

FSLM representation

Lac-Operon

Main related sub-projects

  • Clustering – Meelis Kull
  • Motif discovery – Hendrik Nigul, Triinu Tasa, …
  • Site combinations: Jelena Zaitseva, Asko Tiidumaa
  • Database of Gene Regulation - Hedi Peterson, Eero

Raudsepp, …

  • Annotate sets of genes based on quilt by association

– Jüri Reimand

  • Alternative Splicing – Meelis Kull
  • Software development, visualization, GRID, Web

Services, etc.