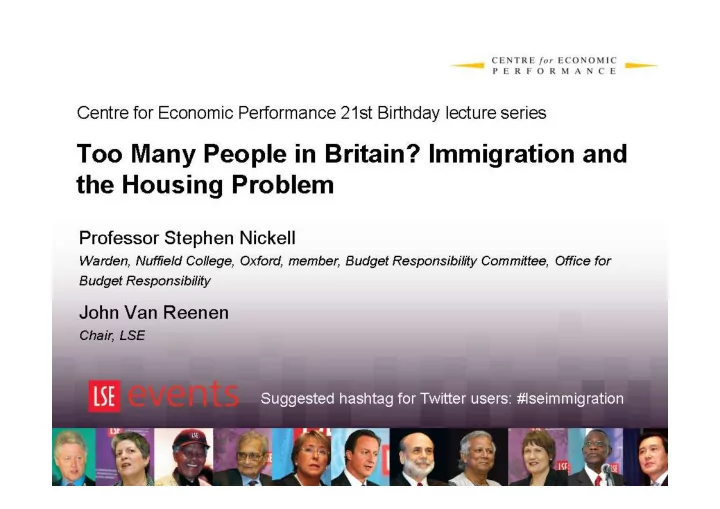

Too Many People in Britain? Immigration and the Housing Problem Stephen Nickell Nuffield College, Oxford June, 2011
Immigration into and out of the United Kingdom Thousands 700 600 Gross Inflow 500 400 Gross Outflow 300 200 100 Net inflow 0 -100 -200 1964 1970 1976 1982 1988 1994 2000 2006 Source: Data are mainly from the International Passenger Survey (IPS). From 1991, the ONS supplement the IPS with administrative data on asylum seekers and their dependents, and estimates of the migrant flow between the United Kingdom and the Irish Republic; the ONS also make other adjustments to account for those whose intended length of stay changes (from less than a year to more than a year, and vice versa). The IPS sampling methodology was also changed in 1999. 1. The number of people (all ages) entering/leaving the United Kingdom with the intention of staying/leaving for at least 1 year.
The foreign-born share of the population aged 16 to 64 Per cent Per cent 1.6 16 1.4 14 1.2 12 All 1 10 0.8 8 Average 0.6 6 0.4 4 'New' immigrants (LHS) 0.2 2 0 0 1984 1989 1994 1999 2004 2009 Source: Labour Force Survey (LFS) and authors’ calculations. 1. The number of 16–64 year olds born outside the United Kingdom as a proportion of the total population aged 16–64. 2. ‘New’ immigrants are those who entered the United Kingdom in the survey year or the year before the survey was carried out. 3. Dotted line is the average share of foreign-born individuals in the UK population between 1985 and 1995. 4. 2009 data capture data to 2009Q3 only.
Immigrant-native ratio by occupation: 1-digit classification (2004–2008) percent 16 14 12 10 8 6 4 2 0 Professionals professionals Administrative Skilled trades Operatives Elementary Managers Caring Sales Associate Source: Labour Force Survey (LFS) and authors’ calculations.
Completions by Tenure in England 4 0 0 0 0 0 3 5 0 0 0 0 3 0 0 0 0 0 2 5 0 0 0 0 2 0 0 0 0 0 1 5 0 0 0 0 1 0 0 0 0 0 5 0 0 0 0 0 1946 1951 1956 1961 1966 1971 1976 1981 1986 1991 1996 2001 2006 P r i v a t e E n t e r p r i s e R e g i s t e r e d S o c i a l L a n d l o r d s L o c a l A u t h o r i t i e s A l l D w e l l i n g s Source: CLG
Residential land price per hectare (England)
Recommend
More recommend