
SLIDE 1
Titel der Präsentation
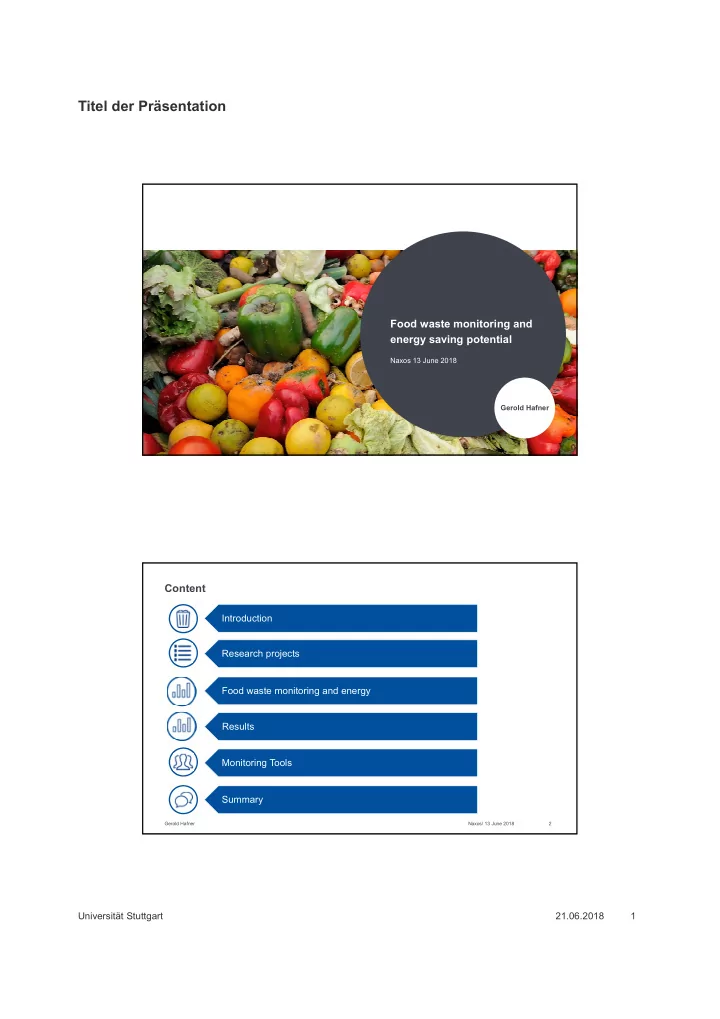
21.06.2018 Universität Stuttgart 1 Food waste monitoring and energy saving potential Naxos 13 June 2018 Gerold Hafner Gerold Hafner 2 Content Introduction Monitoring Tools Food waste monitoring and energy Research projects Summary Results Naxos/ 13 June 2018