
SLIDE 1
Unit 7: Performance Metrics Based on slides by Prof. Amir Roth & Prof. Milo Martin
CIS 371 (Martin): Performance 1
CIS 371 Computer Organization and Design
CIS 371 (Martin): Performance 2
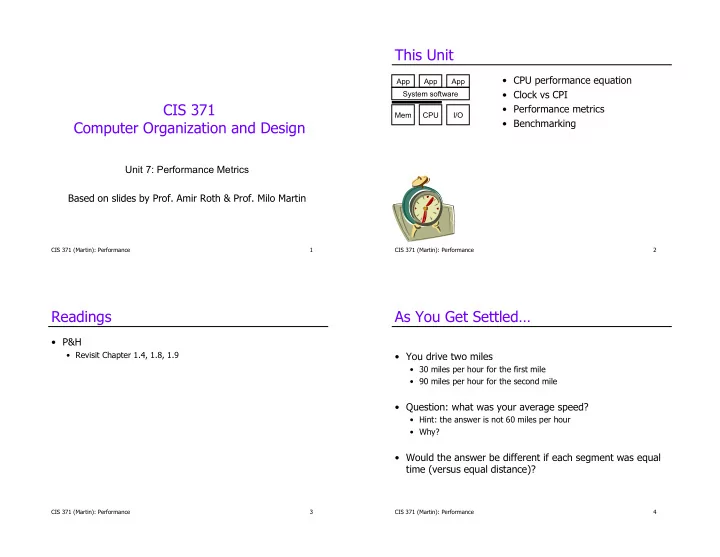
This Unit
- CPU performance equation
- Clock vs CPI
- Performance metrics
- Benchmarking
CPU Mem I/O System software App App App
CIS 371 (Martin): Performance 3
Readings
- P&H
- Revisit Chapter 1.4, 1.8, 1.9
As You Get Settled…
- You drive two miles
- 30 miles per hour for the first mile
- 90 miles per hour for the second mile
- Question: what was your average speed?
- Hint: the answer is not 60 miles per hour
- Why?
- Would the answer be different if each segment was equal
time (versus equal distance)?
CIS 371 (Martin): Performance 4