This presentation is based on a research grant funded by the - - PDF document

this presentation is based on a research grant funded by
SMART_READER_LITE
LIVE PREVIEW

This presentation is based on a research grant funded by the - - PDF document

A Report on the Implementation of Teacher Quality Research to Improve Mathematics in Urban Schools: Quantitative and Qualitative Reasoning about Quantitative Reasoning June 7, 2007, IES 2007 Research Conference This presentation is based on a


slide-1
SLIDE 1

A Report on the Implementation of Teacher Quality Research to Improve Mathematics in Urban Schools: Quantitative and Qualitative Reasoning about Quantitative Reasoning June 7, 2007, IES 2007 Research Conference

This presentation is based on a research grant funded by the Institute of Education Sciences, U.S. Department of Education, Award Number R305M040127 Presenters: Vince Cyboran, Ed.D., Roosevelt University Barbara Radner, Ph.D., DePaul University

OVERVIEW

During 2004-5 and 2005-6, a one-year three-part intervention was provided to two cohorts of teachers

  • f 5th-8th grade students in high poverty Chicago public schools. The treatment, designed to

demonstrate a professional-development structure to improve algebra instruction, included three algebra courses, one course in assessment, “scaffolds” to guide and assess student learning, and support by a “coach” between September-June. A limited treatment group received only the student

  • scaffolds. A control group matched the treatment and limited treatment groups in terms of poverty

level, LEP, and academic achievement as measured by ITBS prior to the treatment.

Treatment Limited Treatment Control 2004-5 14 teachers 331 students 233 students All students grades 5-8, 6 schools 2005-6 15 teachers 325 students 218 students All students grades 5-8, 6 schools

Analysis included an examination of treatment teacher work, as represented in lesson plans and assessments, treatment student learning as represented in student responses to open-ended questions, and quantitative results of ITBS and ISAT tests of students in treatment, limited treatment, and control group. Results of these analyses are summarized here. Although some significant effects were identified, they are limited by the small size of the study.

CONTENT ANALYSIS OF TEACHER AND STUDENT WORK

CONTENT ANALYSIS FRAMEWORK

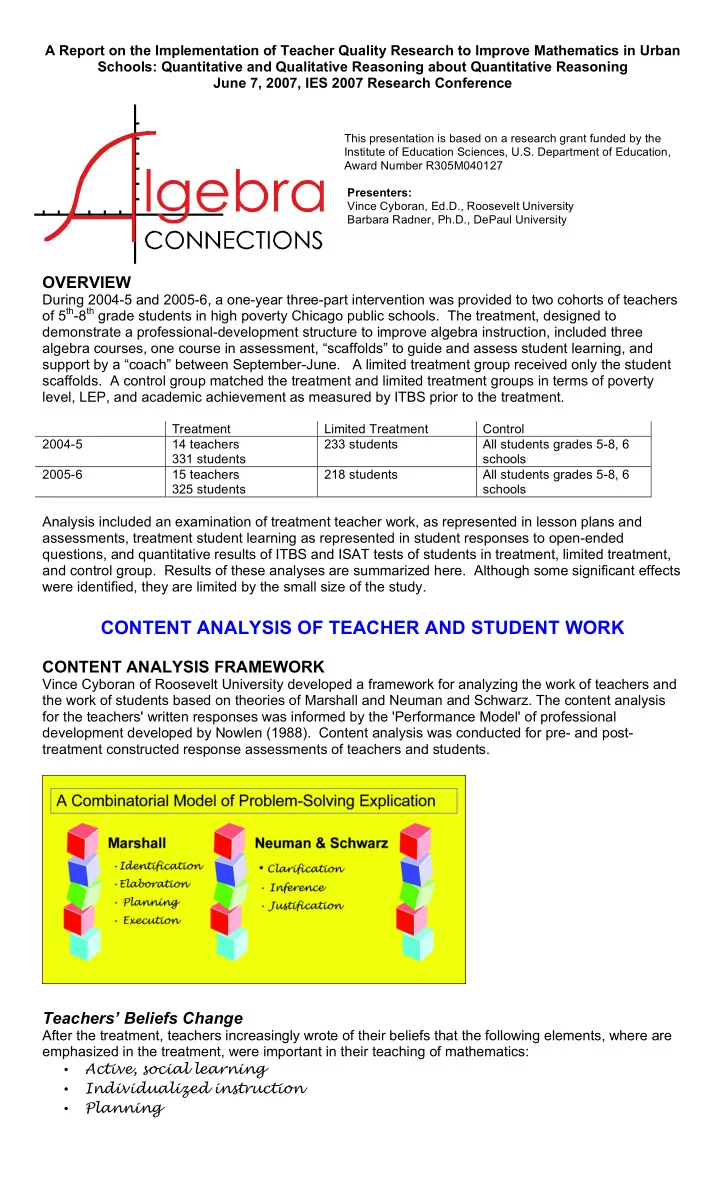
Vince Cyboran of Roosevelt University developed a framework for analyzing the work of teachers and the work of students based on theories of Marshall and Neuman and Schwarz. The content analysis for the teachers' written responses was informed by the 'Performance Model' of professional development developed by Nowlen (1988). Content analysis was conducted for pre- and post- treatment constructed response assessments of teachers and students.

Teachers’ Beliefs Change

After the treatment, teachers increasingly wrote of their beliefs that the following elements, where are emphasized in the treatment, were important in their teaching of mathematics:

  • Active, social learning
  • Individualized instruction
  • Planning
slide-2
SLIDE 2

Student Schemas Change

Scaffolds guided students’ problem solving. Analysis of student problem solving explanations indicates that student writing practices led to improvements in their problem-solving skills, particularly in the following areas which were emphasized in the treatment:

  • Restatement
  • Variety of strategies used
  • Explicit math techniques, such as charting, underlining, and math paths

POST-INTERVENTION TEACHER PARTICIPANT EVALUATION

In spring 2007, the University of Chicago Survey Lab conducted interviews and questionnaires of teachers about their experiences with the program, including reasons for enrollment and program

  • benefits. They obtained feedback from 30 of 38 teachers, including 6 of 7 early leavers and 24 of 31
  • completers. Feedback was strongly positive.

Influence on Teaching Subsequent to the Treatment

Relative Use of Teaching Techniques Since Enrollment as a Result of Program Participation

What was the effect of this program on your use of the following techniques? A lot more A little more No effect A little less A lot less Peer interaction teaching methods

63% (N=15) 33% (N=8) 0% (N=0) 4% (N=1) 0% (N=0)

Student initiated cognitive and meta- cognitive techniques

75% (N=18) 21% (N=5) 0% (N=0) 4% (N=1) 0% (N=0)

Practice

75% (N=18) 21% (N=5) 0% (N=0) 4% (N=1) 0% (N=0)

Teacher-initiated instruction*

52% (N=12) 35% ( N =8) 4% (N=1) 4% (N=1) 4% (N=1)

Teaching to multiple learning styles

67% (N=16) 29% (N=7) 4% (N=1) 0% (N=0) 0% (N=0)

Reframing techniques

58% (N=14) 29% (N=7) 4% (N=1) 4% (N=1) 4% (N=1)

Applications and practical examples

67% (N=16) 33% (N=8) 0% (N=0) 0% (N=0) 0% (N=0)

Affective domain

50% (N=12) 33% (N=8) 13% (N=3) 4% (N=1) 0% (N=0)

Assessment*

50% (N=12) 33% (N=8) 13% (N=3) 0% (N=0) 0% (N=0)

Teacher instruction of cognition

58% (N=14) 38% (N=9) 4% (N=1) 0% (N=0) 0% (N=0)

* One respondent left this question blank.

Limits on Participation and Application

  • After-school/Saturday hours add stress to jobs that are already demanding.
  • Content taught did not match level of some students--“…expectations among math teachers at

some schools may fall below grade-level learning.” It also was difficult for some teachers.

  • Learning styles of some teachers may limit their ability to learn in a group-work approach.

CONCLUSIONS BASED ON CONTENT ANALYSIS AND INTERVIEWS

  • A differentiated instruction approach to teacher education is indicated.
  • High quality instruction in professional development is important to teachers.
  • Having “enforcement” is a strength of teacher development programs.
  • Having immediate “next-day” applicability of lessons is valuable.
  • Teachers’ zone of proximal development considered in planning professional

development and recruiting participants.

slide-3
SLIDE 3

ACHIEVEMENT DATA ANALYSIS

Data analysis by Steve Ponisciak, Ph.D., Consortium on Chicago School Research, University of Chicago

2005 ITBS Analysis Using HLM

Difference in ITBS gain for students in treatment and limited treatment groups, controlling for Concentration of Poverty, Gender, Race/Ethnicity, Grade, whether students were retained or skipped a grade. Results are in ITBS math scale score points, and represent the difference in gain score from the average non- treated student in the relevant grade.

Results come from two-level HLM with students at level 1 and schools at level 2.

Grade 5 Grade 6 Grade 7 Grade 8 Treatment 3.92 3.22

  • 3.61

4.70 Limited Treatment 1.46 2.91

  • 1.26

6.73

Bold = significant at p=0.05

Difference in ITBS gain for students in treatment group with varying levels of teacher commitment

Grade 5 Grade 6 Grade 7 Grade 8 Commitment=1 na na na na Commitment=2 na na

  • 3.62
  • 0.37

Commitment=3

  • 1.19

na na 3.65 Commitment=4 5.99 3.39 na 4.95 Limited Treatment 1.46 2.91

  • 1.26

6.73

Difference in ITBS gain for students in treatment group with varying levels of teacher competence gain

Grade 5 Grade 6 Grade 7 Grade 8 Competence gain=0 3.89 na na 2.91 Competence gain=1 8.12 3.57

  • 2.55
  • 6.49

Competence gain=2

  • 1.43

na na 14.86 Limited Treatment 1.46 2.91

  • 1.25

6.73 Grade Bottom

  • f scale

ITBS Norm Top

  • f

scale CPS average gain SD

  • f

gain CPS average CPS SD 3 101 185 238 na na 180.6 18.8 4 101 200 262 14.2 11.3 196.8 21.9 5 101 214 284 12.9 11.8 208.4 24.3 6 101 227 305 12.4 12.4 221.9 27.6 7 101 239 324 11.7 13.0 233.5 29.9 8 101 250 340 13.9 14.1 247.3 32.2

2006 ITBS Raw Data HLM was not used for the 2006 analysis since the ITBS was administered only to

the Treatment and Limited Treatment classrooms. Difference in ITBS gain for students in treatment and limited treatment groups

Results are in ITBS math scale score points

Grade 5 Grade 6 Grade 7 Grade 8 Treatment minus Limited Treatment 9.24

  • 6.12

0.48 2.02

Bold = significant at p=0.05

Difference in ITBS Gain for students in treatment group with varying levels of teacher commitment

Grade 5 Grade 6 Grade 7 Grade 8 Commitment=4 vs. 3 na 6.56 na 11.49 Commitment=4 vs. 1 na na na 9.27 Commitment=3 vs. 1 na na na

  • 2.22

Difference in ITBS gain for students in treatment group with varying levels of teacher competence gain

Grade 5 Grade 6 Grade 7 Grade 8 Competence gain=1 vs. 0 na

  • 3.50

na 4.64 Competence gain=2 vs. 0 na 14.46 na 4.82 Competence gain=2 vs. 1 8.08 17.96 na 0.18

When comparing 2005 ITBS, there were significant differences at 8th grade using raw data (in the above figure) and also when analyzed with HLM (in the table below). Both analyses—using raw data and HLM—found that there was a significant effect of increase of teacher competence on student achievement at 8th grade.

ITBS Math Scale:

slide-4
SLIDE 4

2006 ISAT (Illinois Standards Achievement Test) Analysis Using HLM

Prior to the 2005-06 school year, Chicago Public Schools administered the ISAT only to students in grades 3, 5, and 8. Therefore, 2005 ISAT data were not analyzed for this project. In 2005-06, CPS discontinued the use of ITBS district-wide, and instead began administering ISAT to grades 3 through 8, which is why 2006 ISAT data are included in the analysis.

Difference in ISAT score for students in treatment and limited treatment groups, Controlling for

Concentration of Poverty, Gender, Race/Ethnicity, Grade, whether students were retained or skipped a grade, and ITBS score. Results are in ISAT math scale score points, and represent the difference from the average non-treated student in the relevant grade. Results come from two-level HLM with students at level 1 and schools at level 2. Grade 5 Grade 6 Grade 7 Grade 8 Treatment

  • 2.17

6.91

  • 2.18

0.88 Limited Treatment 4.23 7.88

  • 4.87
  • 3.33

Bold = significant at p=0.05

Difference in ISAT score for students with varying levels of teacher commitment in treatment group

Grade 5 Grade 6 Grade 7 Grade 8 Commitment=1 NA NA NA

  • 1.18

Commitment=2 NA NA NA NA Commitment=3 NA

  • 5.72
  • 2.62

0.87 Commitment=4

  • 2.17

10.77 NA 1.67 Limited Treatment 4.24 7.88

  • 4.87
  • 3.33

Difference in ISAT score for students with varying levels of teacher competence gain in treatment group

Grade 5 Grade 6 Grade 7 Grade 8 Competence gain=0 NA

  • 5.55

NA

  • 1.18

Competence gain=1

  • 8.01

11.88

  • 2.45

1.89 Competence gain=2

  • 1.53

9.53 NA 0.3 Limited Treatment 4.24 7.89

  • 4.8
  • 3.25

Grade Bottom

  • f scale

Warning/ Below Below/ Meets Meets/ Exceeds Top of scale CPS average CPS SD 3 120 162.5 183.5 223.5 342 198.7 29.1 4 120 171.5 199.5 246.5 355 214.8 26.6 5 120 179.5 213.5 270.5 369 223.0 26.9 6 120 193.5 224.5 275.5 379 235.2 25.2 7 120 206.5 234.5 280.5 393 245.2 27.4 8 120 220.5 245.5 287.5 411 258.1 25.9

CONCLUSIONS BASED ON QUANTITATIVE ANALYSIS

  • Based on analysis of ITBS and ISAT, there are individual class and grade level gains that are

significant, some for treatment and some for limited treatment.

  • That the Limited Treatment had some significant effects for individual classes may indicate that this

relatively low-cost intervention could be implemented with the potential of increasing math learning.

  • That there was such variation in achievement gains among the classes in the treatment group

demonstrates the need to have much larger samples of classes in such a study.

  • To further analyze such interventions, a study would require substantial monitoring for fidelity of

implementation, which in itself would bias the outcomes.

  • The results for some classes indicating that the Limited Treatment contributed to significant gains

provides a basis for further research in using that relatively low-cost intervention and assessing

  • utcomes to determine its effectiveness.

ADDITIONAL PROJECT MATERIALS AND DATA ANALYSIS: http://teacher.depaul.edu/AlgebraConnections.html ISAT Math Scale:

"All ISAT scores are now expressed on a 'vertical'

  • r continuous scale across grades 3 through 8 in

reading and mathematics, and in grades 4 and 7 in

  • science. This scoring system shows the

performance of students in all grades on the same scale…scores for students in higher grades will be higher on average than scores for students in lower grades, indicating that they have learned more." Source: Illinois State Board of Education http://www.isbe.state.il.us/assessment/pdfs/ISAT_S cale_and_Cut_Scores.pdf