Thermal Properties of Materials Thermal Properties of Materials - - PowerPoint PPT Presentation

thermal properties of materials thermal properties of
SMART_READER_LITE
LIVE PREVIEW

Thermal Properties of Materials Thermal Properties of Materials - - PowerPoint PPT Presentation

Thermal Properties of Materials Thermal Properties of Materials Heat Capacity, Content, Energy Storage 6.1, .2, .4, .6 6.1, .2, .4, .6 Heat Capacity, Content, Energy Storage Theory of the equipartition equipartition of energy of


slide-1
SLIDE 1

Thermal Properties of Materials Thermal Properties of Materials

Heat Capacity, Content, Energy Storage Heat Capacity, Content, Energy Storage – – 6.1, .2, .4, .6 6.1, .2, .4, .6

Theory of the Theory of the equipartition equipartition of energy

  • f energy –

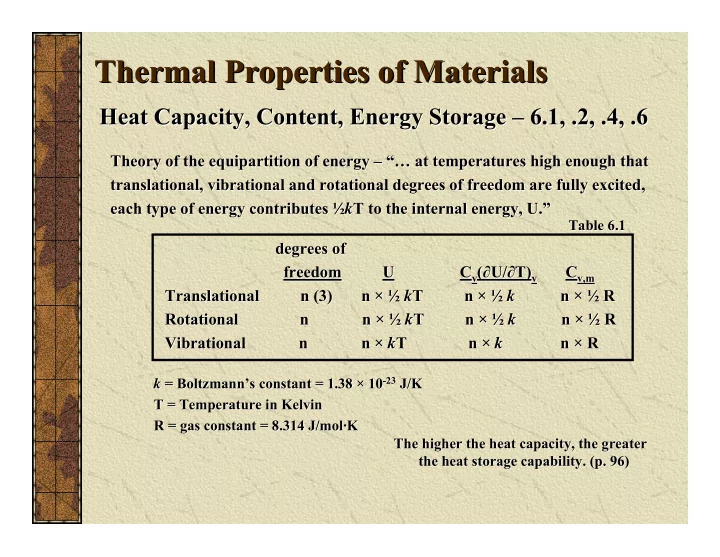
– “… at temperatures high enough that “… at temperatures high enough that translational translational, , vibrational vibrational and rotational degrees of freedom are fully excited, and rotational degrees of freedom are fully excited, each type of energy contributes ½ each type of energy contributes ½k kT T to the internal energy, U.” to the internal energy, U.” degrees of degrees of freedom freedom U U C Cv

v(

(∂ ∂U/ U/∂ ∂T) T)v

v

C Cv

v,m ,m

Translational Translational n (3) n n (3) n × × ½ ½ k kT T n n × × ½ ½ k k n n × × ½ ½ R R Rotational n Rotational n n n × × ½ ½ k kT T n n × × ½ ½ k k n n × × ½ ½ R R Vibrational Vibrational n n n n × × k kT T n n × × k k n n × × R R

k k = = Boltzmann’s Boltzmann’s constant = 1.38 constant = 1.38 × × 10 10-

  • 23

23 J/K

J/K T = Temperature in Kelvin T = Temperature in Kelvin R = gas constant = 8.314 J/mol R = gas constant = 8.314 J/mol· ·K K The higher the heat capacity, the greater The higher the heat capacity, the greater the heat storage capability. (p. 96) the heat storage capability. (p. 96) Table 6.1 Table 6.1

slide-2
SLIDE 2

Thermal Properties of Materials Thermal Properties of Materials

Degrees of Freedom, Heat Capacity Degrees of Freedom, Heat Capacity

Linear Linear Nonlinear Nonlinear Translational Translational 3 3 3 3 Rotational 2 3 Rotational 2 3 Vibrational Vibrational 3N 3N-

  • 5 3N

5 3N-

  • 6

6 dof dof C Cv

v,m ,m

Translational Translational = 3 = 3 3/2R 3/2R Rotational = 3 Rotational = 3 3/2R 3/2R Vibrational Vibrational = 3 = 3 3R 3R An N An N-

  • atom

atom polyatomic polyatomic molecule has 3N degrees of freedom. These are molecule has 3N degrees of freedom. These are divided into divided into translational translational, rotational and , rotational and vibrational vibrational components. components. C Cv

v,m ,m = 6R

= 6R C Cv

v,m ,m (exp) = 3.038R

(exp) = 3.038R Why? Why? Translation and rotational energies are most easily excited (3R) Translation and rotational energies are most easily excited (3R), , while vibrations of gaseous water molecules at room temperature while vibrations of gaseous water molecules at room temperature are are

  • nly slightly active (0.038R).
  • nly slightly active (0.038R).

H H2

2O 3N = 9

O 3N = 9

slide-3
SLIDE 3

Thermal Properties of Materials Thermal Properties of Materials

Heat Capacities of Solids Heat Capacities of Solids

Each atom in a solid has 3 degrees of freedom, and these Each atom in a solid has 3 degrees of freedom, and these are are vibrational vibrational (simple (simple monoatomic monoatomic solids). U = 3kT; solids). U = 3kT; C Cv

v,m ,m = 3R

= 3R 1819, 1819, Dulong Dulong and Petit found for nonmetallic solids at room and Petit found for nonmetallic solids at room temperature, temperature, C Cv

v,m ,m ~ 3R = 25 J/K

~ 3R = 25 J/K· ·mol. (

  • mol. (Dulong

Dulong-

  • Petit Law)

Petit Law) Not explained is why (experimentally) Not explained is why (experimentally) C Cv

v,m ,m

0 as T 0 as T 0K ? 0K ?

slide-4
SLIDE 4

Thermal Properties of Materials Thermal Properties of Materials

Heat Capacities of Solids Heat Capacities of Solids

Einstein model of the heat capacity of a solid Einstein model of the heat capacity of a solid – – The thermal depopulation The thermal depopulation

  • f
  • f vibrational

vibrational energy levels is used to explain why energy levels is used to explain why C Cv

v,m ,m

0 as T 0 as T 0K. 0K. (but predicts values too low at low temperatures) (but predicts values too low at low temperatures) Debye Debye model of the heat capacity of a solid model of the heat capacity of a solid – – Considers the atoms in a Considers the atoms in a solid to be vibrating with a distribution of frequencies, up to solid to be vibrating with a distribution of frequencies, up to ν νD

D.

. θ θD

D =

= h hν νD

D /

/ k k -

  • approximates strength of

approximates strength of interatomic interatomic interactions interactions

  • materials with higher

materials with higher θ θD

D are harder to deform

are harder to deform θ θD

D (K)

(K) Diamond 2230 Diamond 2230 Gold 225 Gold 225 Neon 75 Neon 75 Mercury (solid) 72 Mercury (solid) 72

slide-5
SLIDE 5

Thermal Properties of Materials Thermal Properties of Materials

Heat Capacities of Metals Heat Capacities of Metals

For metals, there is the additional contribution of ‘free’ For metals, there is the additional contribution of ‘free’ conducting electrons (above conducting electrons (above Ef Ef). ). (The first term is from vibrations alone, the second term is the (The first term is from vibrations alone, the second term is the translation of the free electron) translation of the free electron) If each atom had one free valence electron, the total internal e If each atom had one free valence electron, the total internal energy nergy would be: U = 3 would be: U = 3 kT kT + 3/2 + 3/2 kT kT = 4.5 = 4.5 kT kT and and C Cv

v,m ,m = 4.5R

= 4.5R The experimentally observed molar heat capacity of a The experimentally observed molar heat capacity of a monoatomic monoatomic metal is slightly over 3R. metal is slightly over 3R. Only a small fraction of the valence Only a small fraction of the valence electrons must be free to electrons must be free to

  • translate. (one of the first
  • translate. (one of the first

supporting facts for supporting facts for Fermi Fermi statistics) statistics)

slide-6
SLIDE 6

In In-

  • Class Problem Set

Class Problem Set

  • Ch. 6, #11) A new product claims to protect seedlings from freez
  • Ch. 6, #11) A new product claims to protect seedlings from freezing by

ing by surrounding them with vertical cylinders of water. a) How does surrounding them with vertical cylinders of water. a) How does this this device work? (explain in thermodynamic terms), b) Would this device work? (explain in thermodynamic terms), b) Would this device be as effective filled with another liquid, like oil? Exp device be as effective filled with another liquid, like oil? Explain. lain.

  • Ch. 6, #22) The sound velocity varies considerably with depth in
  • Ch. 6, #22) The sound velocity varies considerably with depth in the

the earth’s crust, 8km/s in the upper mantle, and 12km/s in the lowe earth’s crust, 8km/s in the upper mantle, and 12km/s in the lower r

  • mantle. a) How does
  • mantle. a) How does θ

θD

D vary with depth? b) What does the

vary with depth? b) What does the variation of the sound velocity indicate about the interactions variation of the sound velocity indicate about the interactions within within the the crustal crustal materials as a function of depth? c) Suggest an materials as a function of depth? c) Suggest an application of the variation of sound velocity with depth in the application of the variation of sound velocity with depth in the earth earth’ ’s crust. s crust. For next time: Read Ch. 7 (pp. 128 For next time: Read Ch. 7 (pp. 128-

  • 140)

140)

slide-7
SLIDE 7

Thermal Properties of Materials Thermal Properties of Materials

Thermal Expansion of Solids Thermal Expansion of Solids – – 7.1, .3 (133 7.1, .3 (133-

  • 140)

140)

“Almost all materials expand when heated, regardless of the phas “Almost all materials expand when heated, regardless of the phase of matter” e of matter”

  • Related directly to the forces between atoms

Related directly to the forces between atoms

To a 1 To a 1st

st approximation, atoms in a solid

approximation, atoms in a solid can be considered connected to each can be considered connected to each

  • ther by ‘springs’
  • ther by ‘springs’

x x Harmonic Harmonic potential potential V(x) V(x) V(x) = cx V(x) = cx2

2; c = spring stiffness,

; c = spring stiffness, x = displaced distance x = displaced distance *The average value of x is *The average value of x is independent of temperature independent of temperature

slide-8
SLIDE 8

Thermal Properties of Materials Thermal Properties of Materials

Thermal Expansion of Solids Thermal Expansion of Solids

An An anharmonic anharmonic potential more closely approximates the potential more closely approximates the interatomic interatomic forces forces between atoms. between atoms. Atoms will separate when pushed far enough apart Atoms will separate when pushed far enough apart

  • Repulsion of inner electron clouds inhibits close contact

Repulsion of inner electron clouds inhibits close contact

x x anharmonic anharmonic potential potential V(x) V(x) V(x) = cx V(x) = cx2

2 –

– gx gx3

3 –

– fx fx4

4;

; 1 1st

st term

term – – harmonic potential (stiffness) harmonic potential (stiffness) 2 2nd

nd term

term – – asymmetric mutual repulsion asymmetric mutual repulsion 3 3rd

rd term

term – – softening vibrations at large softening vibrations at large amplitudes amplitudes *The average value of x is *The average value of x is dependent on temperature dependent on temperature closer together closer together farther apart farther apart <x> = 3g <x> = 3gk kT / 4c T / 4c2

2

The dimensions of a material will increase The dimensions of a material will increase by a factor that is linear in temperature. by a factor that is linear in temperature.

slide-9
SLIDE 9

Thermal Properties of Materials Thermal Properties of Materials

Thermal Expansion of Solids Thermal Expansion of Solids

Equation for thermal expansion for Equation for thermal expansion for a specific direction of the solid: a specific direction of the solid:

d da a / a = (alpha) / a = (alpha) d dT T Values for the thermal expansion of Values for the thermal expansion of selected materials: selected materials: T(K) T(K) alpha (K alpha (K-

  • 1

1)

) Al 50 3.8 x 10 Al 50 3.8 x 10-

  • 6

6

Al 300 2.32 x 10 Al 300 2.32 x 10-

  • 5

5

Diamond 50 4.0 x 10 Diamond 50 4.0 x 10-

  • 9

9

Diamond 300 1.0 x 10 Diamond 300 1.0 x 10-

  • 6

6

Cu 50 3.8 x 10 Cu 50 3.8 x 10-

  • 6

6

Cu 300 1.68 x 10 Cu 300 1.68 x 10-

  • 5

5

Ice 100 1.27 x 10 Ice 100 1.27 x 10-

  • 5

5

Ice 200 3.76 x 10 Ice 200 3.76 x 10-

  • 5

5

<x> = 3g <x> = 3gk kT / 4c T / 4c2

2

Why does alpha increase at higher Why does alpha increase at higher temperatures? temperatures? Why is the value for diamond so Why is the value for diamond so small, and dramatically increase small, and dramatically increase at higher temperatures? at higher temperatures?

slide-10
SLIDE 10

Thermal Properties of Materials Thermal Properties of Materials

Negative Thermal Expansion of Solids Negative Thermal Expansion of Solids

What would lead a solid to contract while it is being heated? ( What would lead a solid to contract while it is being heated? (it must it must

  • utweigh the normally tendency of bond lengthening)
  • utweigh the normally tendency of bond lengthening)

Solid Solid-

  • state transitions

state transitions – – the average of a the average of a short and long bond is always larger short and long bond is always larger than one that is intermediate between than one that is intermediate between the two. (e.g. Ti the two. (e.g. Ti-

  • O bonds in PbTiO

O bonds in PbTiO3

3)

)

Figure 2 Figure 2

slide-11
SLIDE 11

Thermal Properties of Materials Thermal Properties of Materials

Negative Thermal Expansion of Solids Negative Thermal Expansion of Solids

What would lead a solid to contract while it is being heated? ( What would lead a solid to contract while it is being heated? (it must it must

  • utweigh the normally tendency of bond lengthening)
  • utweigh the normally tendency of bond lengthening)

Transverse Transverse vibrational vibrational modes: modes: The M The M-

  • O distance stays the

O distance stays the same, but the M same, but the M-

  • M distance

M distance shortens. shortens. These These vibrational vibrational modes in a modes in a solid are low in energy, and solid are low in energy, and preferentially excited. preferentially excited. Many solids exhibit NTE at very low temperature (<1/20 Many solids exhibit NTE at very low temperature (<1/20 Debye Debye Temp.), Temp.), such as such as RbCl RbCl, H , H2

2O(ice),

O(ice), Si Si, , Ga Ga, etc. , etc.

Figure 3 Figure 3

slide-12
SLIDE 12

Thermal Properties of Materials Thermal Properties of Materials

Negative Thermal Expansion of Solids Negative Thermal Expansion of Solids

What would lead a solid to contract while it is being heated? ( What would lead a solid to contract while it is being heated? (it must it must

  • utweigh the normally tendency of bond lengthening)
  • utweigh the normally tendency of bond lengthening)

Rigid unit modes ( Rigid unit modes (RUMs RUMs), or ), or rocking modes, also reduces the rocking modes, also reduces the volume of the material. volume of the material. The M The M-

  • O

O-

  • M bending potentials

M bending potentials are as much as 100 times are as much as 100 times weaker than the stiffness of the weaker than the stiffness of the individual polyhedra. individual polyhedra. Example solids: Quartz (SiO Example solids: Quartz (SiO2

2) and

) and Perovskite Perovskite structures (ABO structures (ABO3

3)

)

Figure 6 Figure 6

slide-13
SLIDE 13

Thermal Properties of Materials Thermal Properties of Materials

Negative Thermal Expansion of Solids Negative Thermal Expansion of Solids

What uses are possible for NTE materials? What uses are possible for NTE materials?

High precision optical mirrors (a zero expansion substrate keeps High precision optical mirrors (a zero expansion substrate keeps optical

  • ptical

properties from degrading as a function of temperature) properties from degrading as a function of temperature) Fibre Fibre optic systems, where NTE can be used to compensate for changes i

  • ptic systems, where NTE can be used to compensate for changes in the

n the dimensions of the glass fiber. dimensions of the glass fiber. Adjusting the thermal expansion properties of printed circuit bo Adjusting the thermal expansion properties of printed circuit boards and heat ards and heat sinks in the electronics industry to match those of silicon. sinks in the electronics industry to match those of silicon. To have dental fillings match the thermal expansion coefficients To have dental fillings match the thermal expansion coefficients of teeth.

  • f teeth.

Next Time: Thermal Conductivity of Materials (pp. 144 Next Time: Thermal Conductivity of Materials (pp. 144-

  • 154)

154)

slide-14
SLIDE 14

Thermal Properties of Materials Thermal Properties of Materials

Thermal Conductivity Thermal Conductivity – – Ch. 8, 144

  • Ch. 8, 144-
  • 154

154

J J(energy)

(energy) = The rate of heat transfer per unit time (W) per unit area (m

= The rate of heat transfer per unit time (W) per unit area (m2

2)

)

Thermal conductivity is a Thermal conductivity is a transport property transport property

  • effusion, diffusion, electrical conductivity…

effusion, diffusion, electrical conductivity… A A hot hot cold cold Flux, J(i) = (Amount i flowing) J Flux, J(i) = (Amount i flowing) J W W (unit time) (unit area) m (unit time) (unit area) m2

2s

s m m2

2

= = = =

J Jz

z(energy) =

(energy) = -

  • (kappa) (

(kappa) (d dT T / / d dZ Z) (= W / m ) (= W / m2

2)

) since since d dT T/ /d dZ Z < 0; < 0; J Jz

z(energy) > 0

(energy) > 0

  • The higher the kappa the better the heat conduction

The higher the kappa the better the heat conduction Which would be the better thermal conductor, La or S ? Which would be the better thermal conductor, La or S ? T T Z Z

slide-15
SLIDE 15

Thermal Properties of Materials Thermal Properties of Materials

Re Re-

  • expression of

expression of J Jz

z and kappa in terms of materials’ parameters

and kappa in terms of materials’ parameters

J Jz

z (energy) =

(energy) = -

  • 1/3

1/3 v v(lambda)C ( (lambda)C (d dT T/ /d dZ Z) (8.14) ) (8.14) kappa = kappa = -

  • 1/3

1/3 v v(lambda)C (lambda)C (8.15) (8.15) C = heat capacity per unit volume C = heat capacity per unit volume lambda = mean free path of phonons lambda = mean free path of phonons v v = average speed of phonons = average speed of phonons A A hot hot cold cold In materials, what would tend to give the highest values for kap In materials, what would tend to give the highest values for kappa ? pa ? C (3R limit or better) C (3R limit or better) v v (proportional to force constant, or (proportional to force constant, or theta thetaD

D)

) lambda (crystalline materials) lambda (crystalline materials) Lattice vibrations, also known as Lattice vibrations, also known as phonons phonons, transport heat in solids. , transport heat in solids.

  • Phonons are a quantum of crystal wave energy, traveling at the

Phonons are a quantum of crystal wave energy, traveling at the speed of speed of sound in the medium and manifested by thermal energy. The more sound in the medium and manifested by thermal energy. The more heat, heat, the greater the number of phonons (more excited lattice waves). the greater the number of phonons (more excited lattice waves).

slide-16
SLIDE 16

Thermal Properties of Materials Thermal Properties of Materials

What causes thermal resistance? What causes thermal resistance?

At high temperatures (T > At high temperatures (T > theta thetaD

D)

) C ~ C ~ v v is is lambda lambda

Phonon Phonon-

  • phonon collisions (and

phonon collisions (and anharmonicity anharmonicity) )

Kappa decreases with increasing Kappa decreases with increasing temperature temperature

kappa = kappa = -

  • 1/3

1/3 v v(lambda)C (lambda)C

(8.15) (8.15)

What is the dependence of thermal resistance with temperature? What is the dependence of thermal resistance with temperature?

constant constant independent of temperature independent of temperature decreases with T decreases with T At lower temperatures (T < At lower temperatures (T < theta thetaD

D)

) C C v v is is lambda lambda Kappa increases with increasing Kappa increases with increasing temperatures temperatures increases with T increases with T independent of temperature independent of temperature ~ constant (maximum reached) ~ constant (maximum reached)

slide-17
SLIDE 17

Thermal Properties of Materials Thermal Properties of Materials

Thermal Conductivity of Metals Thermal Conductivity of Metals

In metals, there are two mechanisms to carry heat: In metals, there are two mechanisms to carry heat: 1) Phonons, 2) Electrons 1) Phonons, 2) Electrons Kappa = Kappa = kappa kappaphonon

phonon +

+ kappa kappaelectron

electron

The thermal conductivity of a metal is 10 The thermal conductivity of a metal is 10-

  • 100x that for a nonmetal.

100x that for a nonmetal. Most of the heat is carried by conducting electrons, not phonons Most of the heat is carried by conducting electrons, not phonons. . What are applications for thermally conductive or nonconductive What are applications for thermally conductive or nonconductive materials? materials? kappa kappaelec

elec =

= -

  • 1/3

1/3 v velec

elec(lambda)

(lambda)elec

elecC

Celec

elec

(8.21) (8.21)

slide-18
SLIDE 18

In In-

  • Class Problem Set

Class Problem Set

Make a plot of how the thermal conductivity vs. temperature Make a plot of how the thermal conductivity vs. temperature will change for a pure semiconductor. How will this plot will change for a pure semiconductor. How will this plot compare to that for a metal (show on the same figure)? compare to that for a metal (show on the same figure)? Discuss your assumptions of the changes in Discuss your assumptions of the changes in heat capacity heat capacity, , mean free path mean free path, , average speed average speed and and type type and and number number of the

  • f the

heat carriers as a function of temperature. heat carriers as a function of temperature.

  • Ch. 8, #8) Two countertop materials look very similar; one is
  • Ch. 8, #8) Two countertop materials look very similar; one is

natural marble and the other is synthetic polymer. They natural marble and the other is synthetic polymer. They can be easily distinguished by their feel: one is cold to the can be easily distinguished by their feel: one is cold to the touch and the other is not. Explain which is which and touch and the other is not. Explain which is which and the basis in the difference of their thermal conductivities. the basis in the difference of their thermal conductivities. Next time: Research article on thermoelectric materials Next time: Research article on thermoelectric materials

slide-19
SLIDE 19

Thermal Properties of Materials Thermal Properties of Materials

Thermal Stability of Materials (9.1, 9.3 Thermal Stability of Materials (9.1, 9.3-

  • 9.5, 9.8

9.5, 9.8-

  • 9.10)

9.10)

Phase Diagrams Phase Diagrams – – P P-

  • T plots provides useful information about the properties,

T plots provides useful information about the properties, structures and stability of materials; show the ranges of temper structures and stability of materials; show the ranges of temperature, pressure ature, pressure and composition over which phases are thermodynamically stable. and composition over which phases are thermodynamically stable. Clapeyron Clapeyron Equation Equation d dP P / / d dT T = = ∆ ∆trs

trsH

H / / T T∆ ∆trs

trsV

V Solid to vapor transitions: Solid to vapor transitions: ∆ ∆trs

trsH

H > O; > O; ∆ ∆trs

trsV

V > 0; so > 0; so slope of solid/vapor slope of solid/vapor equilibrium line ( equilibrium line (dP dP / / d dT T) is > 0. ) is > 0. Solid to liquid transitions: Solid to liquid transitions: ∆ ∆trs

trsH

H > O; > O; ∆ ∆trs

trsV

V usually > 0; so usually > 0; so slope of solid slope of solid-

  • liquid line (

liquid line (dP dP / / d dT T) is usually > 0. ) is usually > 0. CO CO2

2 phase diagram

phase diagram However, if However, if ∆ ∆trs

trsV

V < 0 (H < 0 (H2

2O,

O, Ga Ga, , Sb Sb, Bi, , Bi, etc); then etc); then slope ( slope (dP dP / / d dT T) is < 0. ) is < 0.

slide-20
SLIDE 20

Thermal Properties of Materials Thermal Properties of Materials

At low P, negative P At low P, negative P-

  • T solid

T solid-

  • liquid line is negative; the solid is less dense

liquid line is negative; the solid is less dense than the liquid; decrease in freezing point with P than the liquid; decrease in freezing point with P H H2

2Ophase diagram

Ophase diagram The hexagonal form of ice ( The hexagonal form of ice (Ih Ih) has an open structure; structure is not close ) has an open structure; structure is not close packed because of hydrogen bonding optimization. packed because of hydrogen bonding optimization. Ice(s) has many Ice(s) has many polymorphs polymorphs at high pressures owing to many ways to at high pressures owing to many ways to form hydrogen bonds to neighbors; more compressed. form hydrogen bonds to neighbors; more compressed.

slide-21
SLIDE 21

Thermal Properties of Materials Thermal Properties of Materials

Four solid phases, Four solid phases, polymorphism polymorphism arising from shape of molecule; nearly arising from shape of molecule; nearly spherical shape with protuberances at tetrahedral locations. spherical shape with protuberances at tetrahedral locations. Low Low-

  • T CH

T CH4

4

phase diagram phase diagram Very little energy to rotate molecules Very little energy to rotate molecules – – CH CH4

4 molecules in solid I are nearly freely

molecules in solid I are nearly freely rotating, but located on particular lattice sites; rotating, but located on particular lattice sites; orientationally

  • rientationally disordered.

disordered. Other examples: H Other examples: H2

2, N

, N2

2, O

, O2

2, F

, F2

2, CCl

, CCl4

4, C

, C60

60, etc.

, etc.

slide-22
SLIDE 22

Thermal Properties of Materials Thermal Properties of Materials

Graphite is favored at low pressures, diamond at high pressures. Graphite is favored at low pressures, diamond at high pressures. Their Their interconversion interconversion is slow at room T and P is slow at room T and P – – activation energy is high. activation energy is high. Carbon phase diagram Carbon phase diagram Great rearrangement is required; drastically different structure Great rearrangement is required; drastically different structures and properties. s and properties.

slide-23
SLIDE 23

Thermal Properties of Materials Thermal Properties of Materials

F = c F = c – – p + n p + n F = # degrees of freedom F = # degrees of freedom c = # chemical components; # independent chemical species (i.e. c = # chemical components; # independent chemical species (i.e. CaO CaO-

  • SiO

SiO2

2, c

, c = 2; = 2; MgO MgO, c = 1) , c = 1) p = # of phases (i.e. solids, liquids, gases) p = # of phases (i.e. solids, liquids, gases) n = # free variable specifying state of system; n = 2 (T and P) n = # free variable specifying state of system; n = 2 (T and P) or 1 (T or P)

  • r 1 (T or P)

Gibbs’ Phase Rule Gibbs’ Phase Rule – – defines relationship between # of free variables defines relationship between # of free variables specifying state of system, chemical components and phases. specifying state of system, chemical components and phases.

For example: H For example: H2

2O (boiling); c = 1, p = 2 (gas, liquid),

O (boiling); c = 1, p = 2 (gas, liquid), F = 1 (T or P). Either only T or P can vary F = 1 (T or P). Either only T or P can vary independently (a line). independently (a line). H H2

2O (triple point); c = 1, p = 3 (gas, liquid, solid),

O (triple point); c = 1, p = 3 (gas, liquid, solid), F = 0. Invariant point, neither T or P can vary. F = 0. Invariant point, neither T or P can vary.

slide-24
SLIDE 24

Thermal Properties of Materials Thermal Properties of Materials

Condensed Phase Rule Condensed Phase Rule – – Can assume the vapor pressure is negligible Can assume the vapor pressure is negligible (n = 1; only T varies). F = c (n = 1; only T varies). F = c – – p + 1; c = 2; P + F = 3 p + 1; c = 2; P + F = 3

Two Component System Two Component System – – Binary Phase Diagrams Binary Phase Diagrams

Solidus Solidus – – two solids coexist; two solids coexist; lowest T that liquids exist. lowest T that liquids exist. Liquidus Liquidus – – solid/liquid coexists; solid/liquid coexists; liquid changes composition liquid changes composition Eutectic Eutectic – – three phases (A, B, three phases (A, B, liquid) coexist; invariant. liquid) coexist; invariant. No intermediate compounds No intermediate compounds (AB) or solid solutions. (AB) or solid solutions.

slide-25
SLIDE 25

Thermal Properties of Materials Thermal Properties of Materials

Lever Principle Lever Principle – – Mole ratio of phases (on passing through Mole ratio of phases (on passing through liquidus liquidus) is ) is proportional to tie lines connecting to the proportional to tie lines connecting to the liquidus liquidus and solid and solid vertical lines. vertical lines.

Liquid Liquid-

  • Solid Binary Phase Diagrams

Solid Binary Phase Diagrams – – Two component system Two component system

T1 = all liquid; 75% A, 25%B T1 = all liquid; 75% A, 25%B T2 = liquid + A(s) T2 = liquid + A(s) Liquid composition = point b Liquid composition = point b (50% A, 50% B) (50% A, 50% B) % liquid = ac / % liquid = ac / ab ab = 25/50 = 50% = 25/50 = 50% % solid = % solid = cb cb / / ab ab = 25/50 = 50% = 25/50 = 50% T3 = all solid; 75%A, 25%B T3 = all solid; 75%A, 25%B T1 T1 T2 T2 T3 T3 a a b b c c

slide-26
SLIDE 26

Thermal Properties of Materials Thermal Properties of Materials

Phase diagrams can be investigated using cooling curves (tempera Phase diagrams can be investigated using cooling curves (temperature ture-

  • time profiles).

time profiles).

Liquid Liquid-

  • Solid Binary Phase Diagrams

Solid Binary Phase Diagrams – – Two component system Two component system

break point break point (b) is a change in (b) is a change in slope, or change in F slope, or change in F At At halt point halt point(d), F = 0 and p = 2. (d), F = 0 and p = 2. Slice Slice

slide-27
SLIDE 27

Thermal Properties of Materials Thermal Properties of Materials

Evaluation of a cooling curve through the eutectic point. Evaluation of a cooling curve through the eutectic point.

Liquid Liquid-

  • Solid Binary Phase Diagrams

Solid Binary Phase Diagrams – – Two component system Two component system

Slice Slice Eutectic composition melts at a single T without change in compo Eutectic composition melts at a single T without change in composition. sition. (example: (example: Sn Sn/ /Pb Pb solder, Na/K flux, etc.) solder, Na/K flux, etc.)

slide-28
SLIDE 28

Worked Problem Worked Problem

Ch 9, #8) Sketch the Ch 9, #8) Sketch the Sb Sb-

  • Cd

Cd phase diagram (T vs. phase diagram (T vs. X Xcd

cd) based

) based

  • n the following information obtained from a set of
  • n the following information obtained from a set of

cooling curves. cooling curves.

slide-29
SLIDE 29

Thermal Properties of Materials Thermal Properties of Materials

Liquid Liquid-

  • Solid Binary Phase Diagrams

Solid Binary Phase Diagrams – – Solid Formation Solid Formation

Congruently melting compound: Congruently melting compound: AB(s) AB(s) AB(l) AB(l) Incongruently melting compound: Incongruently melting compound: AB(s) AB(s) A(s) + A A(s) + A1

1-

  • x

xB

B(l) (l)

slide-30
SLIDE 30

Thermal Properties of Materials Thermal Properties of Materials

Fe exists in three polymorphs Fe exists in three polymorphs (bcc < 910C; (bcc < 910C; fcc fcc 910 910-

  • 1400C;

1400C; bcc >1400C) bcc >1400C)

The Iron Phase Diagram The Iron Phase Diagram

Only bcc (gamma) dissolves Only bcc (gamma) dissolves appreciable C appreciable C -

  • Austenite

Austenite Eutectoid decomposition Eutectoid decomposition

  • ccurs >723C at grain
  • ccurs >723C at grain

boundaries to give lamellar boundaries to give lamellar textures textures – – Pearlite Pearlite

  • if cooled rapidly,

if cooled rapidly, Martensite Martensite forms. forms.

slide-31
SLIDE 31

In In-

  • Class Problem Set

Class Problem Set

Ch 9, #6) The following are cooling data obtained for Ch 9, #6) The following are cooling data obtained for solutions of Mg and Ni. Two solids form in this system, solutions of Mg and Ni. Two solids form in this system, Mg Mg2

2Ni and MgNi

Ni and MgNi2

  • 2. Plot and label the phase diagram.

. Plot and label the phase diagram.

  • Ch. 9, #28) Label the regions in the
  • Ch. 9, #28) Label the regions in the

Mg/ Mg/Pb Pb phase diagram. Include phase diagram. Include labels for the labels for the solidus solidus, , liquidus liquidus, , eutectic(s), and congruent or eutectic(s), and congruent or incongruent melting solid. incongruent melting solid.