The transition On May 17 th , 2004, Intel, the worlds largest chip - - PDF document

the transition
SMART_READER_LITE
LIVE PREVIEW

The transition On May 17 th , 2004, Intel, the worlds largest chip - - PDF document

15/04/2015 The transition On May 17 th , 2004, Intel, the worlds largest chip maker, canceled the development of the Tejas processor, the successor of the Pentium4-style Prescott processor. On July 27 th , 2006, Intel announced the


slide-1
SLIDE 1

15/04/2015 1

Scuola Superiore Sant’Anna, Pisa Giorgio Buttazzo
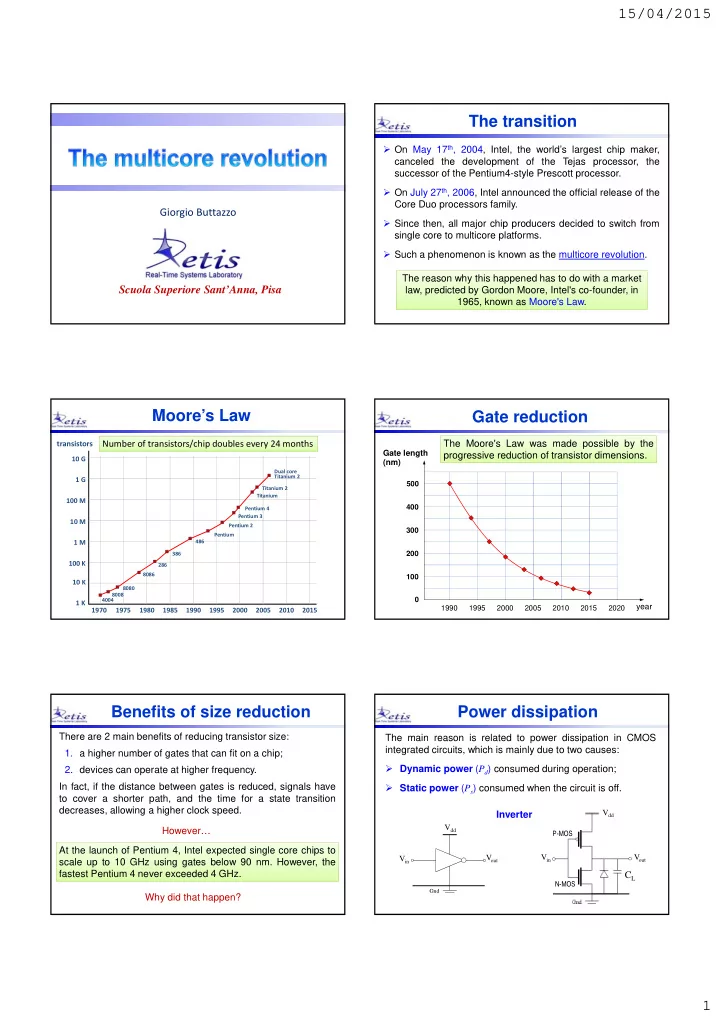
The transition

  • On May 17th, 2004, Intel, the world’s largest chip maker,

canceled the development of the Tejas processor, the successor of the Pentium4-style Prescott processor.

  • On July 27th, 2006, Intel announced the official release of the

Core Duo processors family.

  • Since then, all major chip producers decided to switch from

single core to multicore platforms.

  • Such a phenomenon is known as the multicore revolution.

The reason why this happened has to do with a market law, predicted by Gordon Moore, Intel's co-founder, in 1965, known as Moore's Law.

1 K 1970 10 K 100 K 1 M 10 M 100 M 1 G 10 G 1975 1980 1985 1990 1995 2000 2005 2010 2015

transistors

Moore’s Law

Number of transistors/chip doubles every 24 months

4004 8008 8080 8086 286 386 486 Pentium Pentium 2 Pentium 3 Pentium 4 Titanium Titanium 2 Dual core Titanium 2

Gate reduction

1990 1995 2000 2005 2010 2015 2020

year

400 200 100 500 300

Gate length (nm)

The Moore's Law was made possible by the progressive reduction of transistor dimensions.

Benefits of size reduction

There are 2 main benefits of reducing transistor size:

  • 1. a higher number of gates that can fit on a chip;
  • 2. devices can operate at higher frequency.

In fact, if the distance between gates is reduced, signals have to cover a shorter path, and the time for a state transition decreases, allowing a higher clock speed. Why did that happen? At the launch of Pentium 4, Intel expected single core chips to scale up to 10 GHz using gates below 90 nm. However, the fastest Pentium 4 never exceeded 4 GHz. However…

Power dissipation

The main reason is related to power dissipation in CMOS integrated circuits, which is mainly due to two causes:

  • Dynamic power (Pd) consumed during operation;
  • Static power (Ps) consumed when the circuit is off.

Vin V

  • ut

Vdd

CL Inverter

Vin V

  • ut

Vdd

Gnd

P-MOS N-MOS

slide-2
SLIDE 2

15/04/2015 2

Isc

Vin V

  • ut

Vdd CL

P-MOS N-MOS

Dynamic power

Dynamic power is mainly consumed during logic state transitions to charge and discharge the load capacitance CL.

Isw

2 dd L d

V f C P   

f = clock frequency It can be expressed by:

Static power

Static power is due to a quantum phenomenon where mobile charge carriers (electrons or holes) tunnel through an insulating region, creating a leakage current Ilk Vin V

  • ut

Vdd CL

Ilk

It is independent of the switching activity and is always present if the circuit is on.

lk dd s

I V P 

As devices scale down in size, gate oxide thicknesses decreases, resulting in a larger leakage current.

Dynamic vs. static power

1990 1995 2000 2005 2010 2015 2020

Normalized power

Static Power (leakage) Dynamic Power

year

Gate length (nm): 500 350 250 180 130 90 65 45 22 1 10-2 10-4 10-6 102

Static Power significant at 90 nm

Power and Heat

A side effect of power consumption is heat, which, if not properly dissipated, can damage the chip. If processor performance would have improved by increasing the clock frequency, the chip temperature would have reached levels beyond the capability of current cooling systems.

lk dd dd L

I V V f C P     

2

Scaling down, both f and Ilk increased

Power density (W/cm2)

1000 1000 100 100 10 10 1 0.1 0.1

72 76 80 84 88 92 96 00 04 08 Year

Heating problem

Pentium Tejas cancelled!

Nuclear Reactor

Clock speed limited to less than 4 GHz

4004 8008 8080 8085 8086 286 386 486 Pentium P1 P2 P4 P3

Keeping Moore’s Law alive

The solution followed by the industry to keep the Moore’s law alive was to

  • use a higher number of slower logic gates,
  • building parallel devices that work at lower clock

frequencies.

Switch to Multicore Systems!

In other words…

slide-3
SLIDE 3

15/04/2015 3

1 K 1970 10 K 100 K 1 M 10 M 100 M 1 G 10 G 1975 1980 1985 1990 1995 2000 2005 2010 2015 10GHz 1 GHz 100 MHz 10 MHz 1 MHz 100 KHz

Keeping Moore’s Law alive

  • # of transistors continued to increase according to Moore’s Law
  • clock speed and performance experienced a saturation effect

# Transistors Clock speed

How to exploit multiple cores?

The efficient exploitation of multicore platforms poses a number of new problems that are still being addressed by the research community. When porting a real-time application from a single core to a multicore platform, the following key issues have to be addressed:

  • How to split the code into parallel segments that

can be executed simultaneously?

  • How to allocate such segments to the different

cores?

  • In a multicore system, sequential languages (as

C/C++) are no longer appropriate to specify programs.

  • In fact, a sequential language hides the intrinsic

concurrency that must be exploited to improve the performance of the system.

To really exploit hardware redundancy, most of the code has to be parallelized.

Expressing parallelism A big problem for industry

Parallelizing legacy code implies a tremendous cost and effort for industries, mainly due to:

  • re-design the application
  • re-writing the source code
  • updating the operating system
  • writing new documentation
  • testing the system
  • software certification

To avoid such costs, the cheapest solution is to port the software on a multicore platform, but run it on a single core, disabling all the other cores.

A big problem for industry

However, due to the clock speed saturation effect, a core in a multicore chip is slower than a single core:

If the application workload was already high, running the application on a single core of a multicore chip creates an

  • verload condition.

To avoid such problems, avionic industries buy in advance enough components for ensuring maintenance for 30 years!

Intel Pentium 4 Prescott Intel Core i7 Clock: 2.5 GHz Clock: 3.8 GHz ON OFF OFF OFF

Other problems

In a single core system, concurrent tasks are sequentially executed on the processor, hence the access to physical resources is implicitly serialized (e.g., two tasks can never cause a contention for a simultaneous memory access). Such conflicts not only introduce interference on task execution but also increase the Worst-Case Execution Time (WCET) of each tasks. In a multicore platform, different tasks can run simultaneously

  • n

different cores, hence several conflicts can arise while accessing physical resources.

slide-4
SLIDE 4

15/04/2015 4

19

The WCET issue

While this assumption is correct for single-core chips, it is NOT true for multicore chips! The fundamental assumption Existing RT analysis assumes that the worst-case execution time (WCET) of a task is constant when it is executed alone or together with other tasks.

WCET in multicore

Number of active cores

2 4 6

Normalized WCET

1 3 5

1 2 3 4 5 6 7 8

Benchmark Cache locked (255 pages)

Test by Lockheed Martin Space Systems on 8-core platform

competing with 1 core can double the WCET WCET can be 6 times larger

 Why WCET increases up to 6 times?  Why WCET on 8 cores is lower than WCET on 7 cores?  What does this mean for system development, integration and certification?

Questions

Number of active cores

2 4 6

Normalized WCET

1 3 5 1 2 3 4 5 6 7 8 Benchmark Cache locked (255 pages)

There are multiple reasons

The WCET increases because of the competition among cores in using shared resources.

  • Main memory
  • Memory-bus
  • Last-level cache
  • I/O devices

In a single CPU, only one task can run at a time, so applications cannot saturate memory and I/O bandwidth. Competition creates extra delays

  • waiting for other tasks to release

the resource

  • waiting for accessing the resource

To better understand the interference causes, we need to take a quick look at the modern computer architectures.

Types of Memory

There are typically three types of memory used in a computer: Cache (SRAM)

CPU

BUS

Primary storage

(DRAM) Secondary storage (Disk)

Primary Storage

It is referred to as main memory or internal memory, and is directly accessible to the CPU. It is volatile, which means that it loses its content if power is removed. Primary storage includes RAM (based on DRAM technology), Cache and CPU registers (based on SRAM technology):

  • DRAM (Dynamic random-access memory) requires to be

periodically, refreshed (re-read and re-written) otherwise it would vanish.

  • SRAM (Static random-access memory) never needs to be

refreshed as long as power is applied.

slide-5
SLIDE 5

15/04/2015 5

Secondary Storage

Examples of secondary storage devices are:

  • Hard Disk:

based on magnetic technology

  • CD ROM, DVD:

based on optical technology

  • Flash memory:

can be electrically erased and reprogrammed It is referred to as external memory or auxiliary storage, because it is not directly accessible by the CPU. The access is mediated by I/O channels and data are transferred using intermediate area in primary storage. It is non volatile, that is, it retains the stored information even if it is not constantly supplied with electric power.

Cache Memory

The cache is a local memory used by the CPU to reduce the average time to access data from the main memory. The cache is faster than the RAM, but more expensive, so much smaller in size. Most CPUs have different types of caches:

  • Instruction Cache, to speed up executable instruction fetch
  • Data Cache, to speed up data fetch and store
  • Translation Lookaside Buffer (TLB), used to speed up

virtual-to-physical address translation for both executable instructions and data.

Cache Levels

The data cache is usually hierarchically organized as a set

  • f levels: L1, L2, …

L2 L1I L1D

CPU

single CPU chip

instruction cache data cache L3 TLB

Access times

Logic Unit Registers

CPU

L1 Cache L2 Cache L3 Cache Main Memory Secondary Storage Cache Secondary Storage (Disk) 1 ns 10 ns 20 ns 120 ns 50 s 12 ms 80 ns

capacity latency

16 MB 1 MB 64 KB 1 KB 16 GB 1 TB

price per GB

$ 1000 $ 10 $ 0.1 x 100 x 100

Cache in multicore chips

In multicore architectures, the L3 cache is typically shared among cores: L3 (shared)

L1I L1D Core 1 L2

TLB

L1I L1D Core 2 L2

TLB

multicore chip

CRPD: delay introduced by high priority tasks that evict cache lines containing data used in the future:

Cache related preemption delay

1 2

Cache write A

A

write B read A read A cache miss cache hit

B

Extra time is needed for reading A, thus increasing the WCET of 2.

slide-6
SLIDE 6

15/04/2015 6

WCET

Task executing alone (or non preemptively) on a single CPU:

i i

Task experiencing preemptions by higher priority tasks: Ci

NP

Ci = Ci + CRPD

NP

WCETi

  • In multicore systems, L1 and L2

caches have the same problem seen in single-core systems.

CRPD in multicore systems

L1I L1D Core 2 L2

TLB

L1I L1D Core 1 L2

TLB

L3

  • L3 cache lines can also be

evicted by applications running

  • n different cores.
  • We can partition the last level cache to simulate the cache

architecture of a single-core chip, but the size of each partition becomes rather small.

Resource conflicts

When applications in different cores run concurrently and access physical resources, several conflicts may occur:

Main Memory L3 Cache

L1 Cache Core 1 L1 Cache Core 2

L3 Cache Core 1 Core 2

L2 Cache L2 Cache Multicore CPU1 Multicore CPU2

High penalty In multicore systems task WCETs will be higher due to

  • eviction on shared caches
  • bus/network arbitration

Consequence on WCET

Alone

  • n single CPU

Concurrent

  • n single CPU

Concurrent

  • n multicore

i i i

  • Interference

depends

  • n

several factors, (such as allocation, task flow, specific data inputs, task activation times), all summing up and contributing to its randomness.

  • When

more cores are used, inter-core interferences increase.

  • However, the random nature of interference may introduce

deviations from the average case, which explain why the WCET on 8 cores is less than WCET on 7 cores.

  • The implication of this phenomenon is that worst-case

timing analysis, testing, and certification becomes extremely complex!

Randomness of interference WCET distribution

High uncertainty Execution times vary more, because interference depends on

  • phase between cores (synchronization, scheduling)
  • access pattern to shared resource (program paths)
  • accessed memory locations (program state)

multicore single core

Cmin C

distribution

slide-7
SLIDE 7

15/04/2015 7

Main Memory

Typical multicore platform

Dev. 1 Dev. 2 Dev. 3 Dev. 4

L1I L1D Core 2 L2

TLB

L1I L1D Core 1 L2

TLB

L3 L1I L1D Core 2 L2

TLB

L1I L1D Core 1 L2

TLB

L3

System Bus Multicore CPU1 Multicore CPU2

Memory banks

Dev. 1 Dev. 2 Dev. 3 Dev. 4

L1I L1D Core 2 L2

TLB

L1I L1D Core 1 L2

TLB

L3 L1I L1D Core 2 L2

TLB

L1I L1D Core 1 L2

TLB

L3

System Bus

Bank 1 Bank 2 Bank 3 Bank 4 Main Memory

To reduce memory conflicts, the DRAM is divided into banks:

Main memory conflicts

Still, when cores concurrently access the main memory, DRAM accesses have to be queued, causing a significant slowdown:

L3 Memory Controller

Core 1 Core 2 Core 3 Core 4

Bank 1 Bank 2 Bank 3 Bank 4 Main Memory

A similar problem occurs when tasks running in different cores request to access I/O devices at the same time:

I/O conflicts

System Bus Core1 Core2 Core3 Core4 Dev 4 Dev 3 Dev 2 Dev 1

Test on Intel-Xeon

  • Diffbank: Core0  Bank0, Core1-3  Bank 1-3
  • Samebank: All cores  Bank0

Types of multicore systems

ARM’s MPCore STI’s Cell Processor

  • 4 identical ARMv6 cores
  • One Power Processor Element
  • 8 Synergistic Processing Element
slide-8
SLIDE 8

15/04/2015 8

Expressing parallelism

Code parallelization can be done at different levels:

  • Parallel programming languages

(e.g., Ada, Java, CAL).

  • Code annotation.

The information on parallel code segments and their dependencies is inserted in the source code of a sequential language by means of special constructs analyzed by a pre-compiler (e.g., OpenMP). For instance, CAL [UC@Berkeley, 2003] is a dataflow language.

  • Algorithms are described by modular components

(actors), communicating through I/O ports:

  • Actions read input tokens, modify the internal

state, and produce output tokens.

Internal state Actions

Actor

Expressing parallelism Expressing parallelism

OpenMP specifies parallel code by the pragma directive. In any case, a suitable task model is needed to represent and analyze parallel applications. #pragma omp parallel for for (i=0; i<n; i++) b[i] = a[i] / 2.0; For instance, the following for statement is executed as n parallel threads: A sequential task can be efficiently represented by the Liu & Layland model, described by 3 parameters: (Ci, Ti, Di)

# occurrencies

execution time

Ci

min

Ci

max

WCET

Task model

Representing a parallel code requires more complex structures like a graph:

Task model

Restrictions are needed to simplify the analysis Graph models

A Directed Acyclic Graphs (DAG) is a graph in which links have a direction and there are not cycles:

Directed Acyclic Graphs

In a DAG this connection is forbidden

slide-9
SLIDE 9

15/04/2015 9

Fork-Join graphs

Computation is view as a sequence of parallel phases (fork nodes) followed by synchronization points (join nodes):

  • A join node is executed
  • nly after all immediate

predecessors are completed.

  • After a fork node, all

immediate successors must be executed (the

  • rder does not matter).

Conditional graphs

They are graphs in which there are nodes that express a conditional statement:

  • Only one node among all immediate successors

must be executed, depending on the data:

switch if-then

And-Or Graphs

It is the most general graph representation where:

  • OR nodes represent conditional statements (

)

  • AND nodes represent parallel computations (

)

Application model

An application can be modeled as a set of tasks, each described by a task graph:

A node represents a sequential portion of code that cannot be further parallelized

A task graph specifies the maximum level of parallelism

Application Task 1 Task n

  • Arrival pattern
  • Periodic (activations exactly separates by a period T)
  • Sporadic (Minimum Interarrival Time T)
  • Aperiodic (no interarrival bound exists)
  • Is preemption allowed at arbitrary times?
  • Is task migration allowed?

Task parameters: {C1, C2, C3, C4, C5}, D, T

Assumptions and parameters

1 2 5 3 4

Task parameters: {C1, C2, C3, C4, C5, C6}, D, T

Example

1 3 2 1 2 3

T

1 2 3 4 5 6 7 8 9 10 11 12 13 14 15 16 17 18 19 20

D Interpretation on an unlimited number of cores

slide-10
SLIDE 10

15/04/2015 10

1 2 3 4 5 Required CPU bandwidth:

T Cs U =

Important factors

(Cs  D)  A is feasible on a single core Ci

Cs =

Sequential Computation Time (Volume):

(Cp > D)  A is not feasible in any number of cores

1 2 3 4 5

critical path

1 2 3 4 5

Cp D Parallel Computation time

Cp = length of a

critical path

Important factors Performance issues

Assuming we are able to express the parallel structure

  • f our source code,
  • How much performance can we gain by switching

from 1 core to m cores?

  • How

can we measure the performance improvement? It measures the relative performance improvement achieved when executing a task on a new computing platform, with respect to an old one. Rold Rnew S = Rold = response time on the old platform Rnew = response time on the new platform

Speed-up factor

If the old architecture is a single core platform and the new architecture is a platform with m cores (each having the same speed as the single core one), the speedup factor can be expressed as S = R1 Rm R1 = response time on 1 processor Rm = response time on m processors

Speed-up factor Speed-up factor

/m 1    1  

S = R1 Rm 1 1   + /m =

 = fraction of parallel code m = number of processors

1   + /m

Rm = L(1   + /m) R1 = L

L = length of sequential code

slide-11
SLIDE 11

15/04/2015 11

Speed-up factor

[Amdahl’s law] m 1

1 m = 100  = 0.5 S = 2

S (m,) 1 1   + /m = S()

  • For large m:

m S      1 1    

 

1 1 ) (

m

S

m

1 2 4 8 16 32 64 128 256 512 1024 2048 4096 8192 16384 32768 65536 2 4 6 8 10 12 14 16 18 20

S

 = 0.95  = 0.9  = 0.75  = 0.5

Amdahl’s Law

Speed-up factor Considerations

  • Law of diminishing returns:

Each time a processor is added the gain is lower

  • Performance/price rapidly fall down as m increases
  • Considering communications costs, memory, bus

conflicts, and I/O bounds, the situation gets worse

  • Parallel computing is only useful for

– limited numbers of processors, or – highly parallel applications (high values of )

When MP is not suited

Applications having some of the following features are not suited for running on a multicore platform:

  • I/O bound tasks;
  • Tasks

composed by a series

  • f

pipeline dependent calculations;

  • Tasks that frequently exchange data;
  • Tasks that contend for shared resources.

Other issues

  • How to allocate and schedule concurrent tasks on a

multicore platform?

  • How to analyze real-time applications to guarantee

timing constraints, taking into account communication delays and interference?

  • How to optimize resources (e.g., minimizing the

number of active cores under a set of constraints)?

  • How to reduce interference?
  • How to simplify software portability?

Multiprocessor models

  • Identical

Processors are of the same type and have the same

  • speed. Each task has the same WCET on each processor.
  • Uniform

Processors are of the same type but may have different

  • speeds. Task WCETs are smaller on faster processors.
  • Heterogeneous

Processors can be of different type. The WCET of a task depends on the processor type and the task itself.

slide-12
SLIDE 12

15/04/2015 12

Identical processors

Processors are of the same type and speed. Tasks have the same WCET on different processors. P1 P2 P3 Task 1 Task 2

Uniform processors

Processors are of the same type but different speed. Task WCETs are smaller on faster processors. P1 P2 P3 Task 1 Task 2

speed = 1 speed = 2 speed = 3

Heterogeneous processors

Processors are of the different type. WCETs depend on both the processor and the task itself. P1 P2 P3 Task 1 Task 2

1 GHz small cache FPU 2 GHz large cache I/O coproc. 4 GHz small cache no FPU