SLIDE 2 2
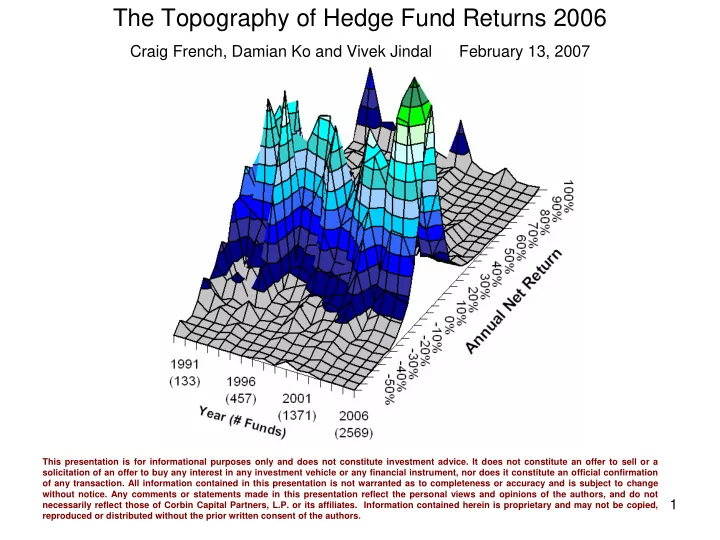
The Topography of Hedge Fund Returns 2006
Craig French, Damian Ko and Vivek Jindal February 13, 2007
SUMMARY In the following set of charts we review the opportunity sets of 9 Hedge Fund strategies, plus Funds of Funds, over the past 17 years, examining all managers that existed for all 12 months of each calendar year in the HFR database. We plot the average return each year on the “terrain” of intertemporal cross-sectional distributions, and view the “topography” of the distributions -- higher “mountain peaks” and narrower “land masses” indicate more return concentration. Several characteristics become apparent: 1. We are currently in an era of compressed returns, and 2006 returns are coming off the high peaks of concentration in 2005; generally we see higher cross sectional return dispersion in 2006 than we did last year. 2. In 2006 we saw slightly higher average returns than in 2005 across most strategies. In Equity Long Short, for example, where 27% of managers clustered between 9% and 11% annual returns in 2005, only 21% of managers clustered in the 13-16% annual returns range in 2006. The average return of the 1,096 managers in this category was 12.40% for 2006 (up from 11.80% in 2005.) 3. The number of managers reporting to HFR in 2006 (which had full calendar-year returns) increased in all of the examined categories except Commodity Trading Advisors which held steady at 242 managers, and Fixed Income Arbitrage which decreased from 70 to 65, its 2004 level. 4. 98% of the 1,269 Fund-of-Funds' returns for 2006 fell between -2% and +28%, and 40% of them clustered between 9% and 11% annual return. The mean Fund-of-Funds in this sample returned 10.23% in 2006, up from 7.41% in 2005. 5. Distressed (162 funds) and Event-Driven (171 funds) had a bounce-back in their mean returns from 2005 levels of 7.81% (to 13.27% in 2006) and 7.05% (to 14.76% in 2006), respectively. These returns are almost back to their 2004 mean return levels of about 15% each, but still shy of 2003 levels of 28% and 36% returns, respectively. Both strategies remained fairly concentrated, with about 30% of the managers in each category clustering around the 2006 average return level. 6. Arbitrage (especially the 106 Convertible Arb funds) enjoyed a nice big bounce in their mean return levels over their 2005 levels. Convertible managers returned 11.32% on average in 2006 versus 4.74% in 2005. Concentration of returns across Convertible Arbitrage managers has been reduced from its high of 46% clustering around 5% annual returns in 2004 to only 30% of managers clustering in the 12-15% range in 2006. 7. The 204 Global Trading managers had wide dispersion in 2006, with 98% of them reporting returns ranging from -12% to +35%, with an average of 7.66%. About 22% of the funds clustered in the 7% to 11% return range.