The The world d is skewed Ignorance, use, misuse, - - PDF document

the the world d is skewed
SMART_READER_LITE
LIVE PREVIEW

The The world d is skewed Ignorance, use, misuse, - - PDF document

11/28/15 The The world d is skewed Ignorance, use, misuse, misunderstandings, and how to improve uncertainty analyses in software development projects Magne


slide-1
SLIDE 1

11/28/15 1

The The ¡ ¡world ¡ d ¡is ¡ ¡skewed

Ignorance, ¡use, ¡misuse, ¡ misunderstandings, ¡and ¡how ¡to ¡ improve ¡uncertainty ¡analyses ¡in ¡ software ¡development ¡projects Magne Jørgensen Simula Research ¡Laboratory

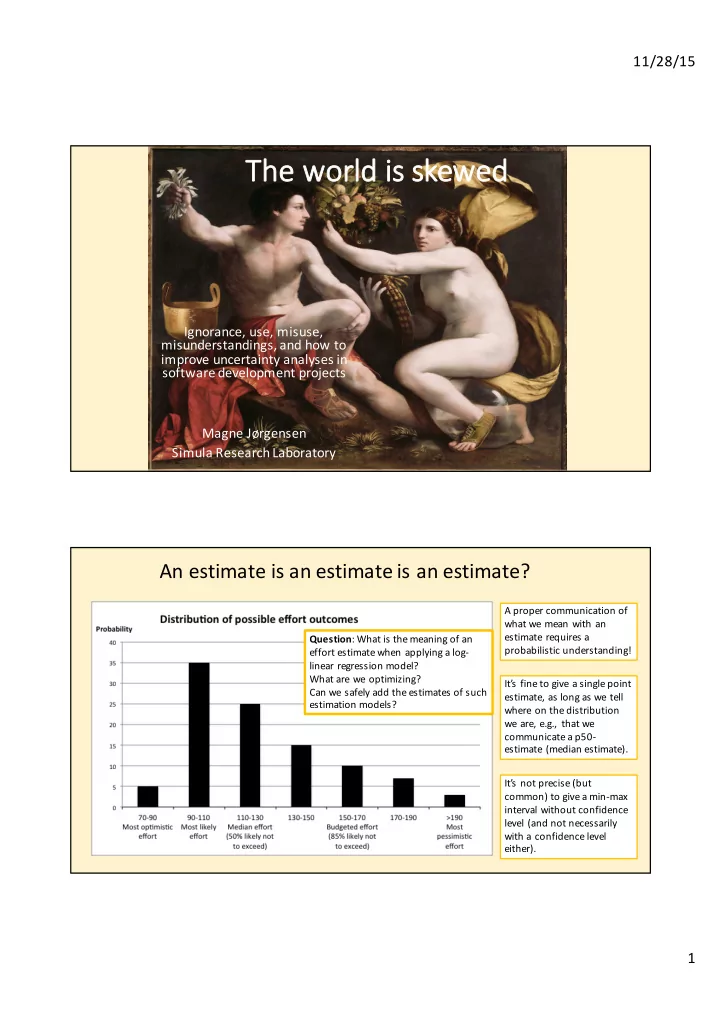
An ¡estimate is ¡an ¡estimate is ¡an ¡estimate?

A ¡proper ¡communication ¡of ¡ what ¡we ¡mean ¡with ¡an ¡ estimate ¡requires ¡a ¡ probabilistic ¡understanding! It’s ¡fine ¡to ¡give ¡a ¡single ¡point ¡ estimate, ¡as ¡long ¡as ¡we ¡tell ¡ where ¡on ¡the ¡distribution ¡ we ¡are, ¡e.g., ¡ that ¡we ¡ communicate ¡a ¡p50-­‑ estimate ¡(median ¡estimate). It’s ¡not ¡precise ¡(but ¡ common) ¡to ¡give ¡a ¡min-­‑max ¡ interval ¡without ¡confidence ¡ level ¡(and ¡not ¡necessarily ¡ with ¡a ¡confidence ¡level ¡ either). Question: ¡What ¡is ¡the ¡meaning ¡of ¡an ¡ effort ¡estimate ¡when ¡applying ¡a ¡log-­‑ linear ¡regression ¡model? ¡ What ¡are ¡we ¡optimizing? ¡ Can ¡we ¡safely ¡add ¡the ¡estimates ¡of ¡such ¡ estimation ¡models?

slide-2
SLIDE 2

11/28/15 2

Answers ¡(log-­‑linear ¡effort ¡estimation ¡model): ¡

  • When ¡we ¡use ¡ln(Effort) ¡as ¡the ¡dependent ¡variable ¡in ¡linear ¡regression, ¡we ¡try ¡to ¡

find ¡the ¡arithmetic ¡mean ¡of ¡the ¡transformed ¡and ¡the ¡geometric ¡mean ¡of ¡the ¡non-­‑ transformed ¡effort ¡outcome ¡distribution ¡(given ¡values ¡of ¡the ¡independent ¡ variables). ¡

  • The ¡median ¡value ¡equals ¡the ¡geometric ¡mean ¡of ¡a ¡log-­‑normal ¡ distribution. ¡ The ¡median ¡value ¡

will ¡be ¡the ¡same ¡for ¡the ¡normal ¡ and ¡the ¡log-­‑normal ¡ distribution.

  • Consequently, ¡ the ¡meaning ¡of ¡an ¡estimate ¡in ¡the ¡context ¡of ¡a ¡log(Effort), ¡linear ¡

regression-­‑based ¡estimation ¡model ¡is ¡the ¡median ¡effort ¡(the ¡p50-­‑estimate).

  • To ¡find ¡ the ¡expected ¡ value ¡each ¡estimate ¡has ¡to ¡be ¡multiplied ¡ with ¡ evar(error)/2
  • The ¡median ¡effort ¡has ¡the ¡following ¡properties: ¡
  • It ¡is ¡the ¡value ¡that ¡minimizes ¡ the ¡error ¡ of ¡the ¡absolute deviation ¡between ¡the ¡estimate ¡and ¡the ¡

actual ¡effort, ¡ but ¡not the ¡relative ¡deviation.

  • Adding ¡median ¡effort ¡estimates ¡will ¡typically ¡under-­‑estimate ¡ the ¡total ¡ effort ¡in ¡situations ¡ with ¡

right-­‑skewed ¡distributions ¡ (which ¡is ¡nearly ¡always ¡the ¡case).

  • Much ¡studied ¡under ¡ the ¡term ¡“the ¡ retransformation ¡ problem”, ¡ but ¡not ¡much ¡awareness ¡in ¡the ¡

SE ¡literature ¡ …

What about the software industry? ¡ Do ¡they know and ¡communicate what they mean with an ¡effort estimate?

slide-3
SLIDE 3

11/28/15 3

A survey among software professionals

“You ¡have ¡just ¡estimated ¡the ¡number ¡of ¡work-­‑hours ¡you ¡think ¡you ¡need ¡to ¡develop ¡and ¡ test ¡four ¡different ¡software ¡systems. ¡Please ¡select ¡the ¡description ¡below ¡that ¡you ¡think ¡is ¡ closest ¡to ¡what ¡you ¡meant ¡by ¡your ¡effort ¡estimate ¡in ¡the ¡previous ¡four ¡estimation ¡tasks:

  • Number ¡of ¡work-­‑hours ¡I ¡will ¡use ¡given ¡that ¡I ¡experience ¡almost ¡no ¡problems.
  • Number ¡of ¡work-­‑hours ¡I ¡will ¡use ¡given ¡that ¡I ¡experience ¡no ¡major ¡problems.
  • Number ¡of ¡work-­‑hours ¡I ¡most ¡likely ¡will ¡use.
  • Number ¡of ¡work-­‑hours ¡where ¡it ¡is ¡about ¡just ¡as ¡likely ¡that ¡I ¡will ¡use ¡more ¡ ¡as ¡it ¡is ¡that ¡I ¡

will ¡use ¡less ¡effort ¡than ¡estimated.

  • Number ¡of ¡work-­‑hours ¡where ¡it ¡is ¡unlikely ¡that ¡I ¡will ¡use ¡more ¡effort ¡than ¡estimated.
  • Number ¡of ¡work-­‑hours ¡based ¡on ¡my ¡expert ¡judgment/feeling ¡of ¡how ¡many ¡work-­‑hours ¡I ¡

will ¡use. ¡ ¡I ¡find ¡it ¡difficult ¡to ¡decide ¡about ¡the ¡exact ¡meaning ¡of ¡the ¡estimate.

  • None ¡of ¡the ¡above ¡descriptions ¡is ¡close ¡to ¡what ¡I ¡typically ¡mean ¡by ¡an ¡effort ¡estimate.”

Interpretation (as ¡claimed in ¡hindsight) Frequency of interpretation Ideal ¡effort 37% Most ¡likely effort 27% Median ¡effort (p50) 5% Risk ¡averse effort 9% Don’t know/gut ¡feeling/other 22%

slide-4
SLIDE 4

11/28/15 4

Sometimessoftware companies try to ¡include uncertaintyin ¡their effort estimates. ¡

Some do ¡it ¡as ¡in ¡the table below Exercise: ¡Find (at ¡least) ¡four problems

Activity Minimum effort (best ¡case, ¡

  • ptimistic)

Estimate Maximum ¡ effort (worst case, ¡ pessimistic) Activity A 15 ¡work-­‑ hours 20 ¡work-­‑ hours 25 ¡work-­‑ hours Activity ¡B 40 ¡work-­‑ hours 60 ¡work-­‑ hours 80 ¡work-­‑ hours Activity ¡C 45 ¡work-­‑ hours 50 ¡work-­‑ hours 55 ¡work-­‑ hours SUM effort 100 ¡work-­‑ hours 130 ¡work-­‑ hours 160 ¡work-­‑ hours

1. Not ¡communicating of what is ¡meant by ¡ minimum, ¡ estimate (most ¡likely?) ¡and ¡ maximum 2. Too ¡symmetric intervals. ¡The ¡outcome distribution is ¡typically right-­‑skewed. 3. Too ¡narrow intervals. ¡Strong tendency towards too narrow effort intervals to ¡reflect, ¡ for ¡ example, ¡a ¡90% ¡confidence inerval. 4. Incorrect additions. ¡ It ¡is ¡only the mean values that can be ¡safely added, ¡not ¡the most ¡likely, ¡ the minimum ¡or ¡the maximum effort. ¡Adding most ¡likely estimates leads ¡to ¡underestimation in ¡a ¡right-­‑skewed world.

slide-5
SLIDE 5

11/28/15 5

A ¡brief ¡side-­‑track ¡on ¡adding ¡ estimates ¡in ¡a ¡right-­‑skewed ¡world

Most likely cost = 50 Median cost = 60 Mean cost = 65

What ¡is ¡the ¡most ¡likely ¡cost ¡(sum) ¡of ¡ 100 ¡times ¡shopping?

slide-6
SLIDE 6

11/28/15 6

Most likely sum is 6500! The sum of most likely (50 x 100) = 5000) or median (60 x 100 = 6000) would lead to substantial underestimation!

A ¡few, ¡more ¡”advanced” ¡companies do ¡it ¡with asymmetric and ¡wider intervals, ¡and ¡the use of ”PERT”. ¡Still ¡problematic?

Activity Minimum effort (p10) Most likely (ML) ¡ effort Maximum ¡effort (p90) Mean effort PERT ¡effort = (Min+4ML+Max)/6) Variance of effort PERT variance = (Max ¡– Min)2/36 Activity ¡A 15 ¡work-­‑hours 20 ¡work-­‑hours 40 ¡work-­‑hours 23 ¡work-­‑hours 17 Activity ¡B 50 ¡work-­‑hours 60 ¡work-­‑hours 100 ¡work-­‑hours 65 ¡work-­‑hours 69 Activity ¡C 45 ¡work-­‑hours 50 ¡work-­‑hours 150 ¡work-­‑hours 66 ¡work-­‑hours 306 Sum Expected value = 154 ¡work-­‑hours 392 ¡(stdev = ¡20) Uncertainty p85 (85% conf. ¡not ¡to ¡exceed) ¡equals ca. ¡exp. value + ¡stdev 154 ¡+ 20 ¡= ¡174 ¡wh

  • The ¡assumption of the PERT
  • ­‑formula is ¡the unrealistic assumptionthat min=p0 ¡and ¡max=p100. ¡Does not ¡affect mean

effort much, ¡but the variance get much too small. ¡Should divide variance (assuming p10 ¡as ¡min ¡and ¡p90 ¡as ¡max) ¡by ¡

  • approx. ¡2.652= ¡7.0 ¡instead of 36! ¡PERT ¡gives much too narrow intervals.
  • No ¡support ¡for ¡knowing what a ¡p10 ¡and ¡p90 ¡estimate should be ¡(No ¡diff betwen 75%, ¡80%, ¡90% ¡and ¡98% ¡confidence

intervals.)

slide-7
SLIDE 7

11/28/15 7

What to ¡do? ¡A ¡long way to ¡go …

A ¡simple ¡approach leading to ¡more ¡realistic effort uncertainty asessments

1. Estimate the most ¡likely effort of the new project or ¡task. 2. Identify the ”reference class” ¡(similarlyestimationcomplexityof projects or ¡ tasks). 3. Recall the estimationerror distribution of the reference class. 4. Use the estimationerror distribution to ¡find p10, ¡p50 ¡(plan), ¡p80 ¡(budget), ¡p90 ¡

  • r ¡whatever estimate youneed.

Example: ¡

  • You estimate the most ¡likely effort a ¡new project to ¡be ¡1000 ¡work-­‑hours and ¡want

to ¡find the p90-­‑estimate ¡(whichwill be ¡your maximum effort). ¡

  • In ¡the reference class of similar projects you find that 90% ¡of the projects had an ¡

effort overrun of 60% ¡of less ¡(= ¡10% ¡had more ¡than 60% ¡overrun). ¡ ¡

  • Your ¡p90-­‑estimate ¡should consequently be ¡1000 ¡+ ¡60% ¡of 1000 ¡= ¡1600 ¡work-­‑hours.
slide-8
SLIDE 8

11/28/15 8

We have ¡evaluatedand ¡ implementedthis approach in ¡ real-­‑world contexts

16

Experiment

  • 19 ¡estimationteams ¡of software professionals in ¡one company.
  • Estimationof the most ¡likely effort of a ¡project, ¡which had just ¡started
  • Estimationof the uncertainty in ¡terms ¡of 90%-­‑confidence intervals (p5 ¡and ¡p95).
  • Twogroups: ¡
  • Group ¡A: ¡Uncertainty assessment ”as ¡usual”. ¡No ¡support ¡for ¡minimum ¡and ¡

maximum judgemnts.

  • Group ¡B: ¡Create the error distribution of the reference class. ¡Provide

minimum ¡and ¡maximum effort.

  • Results: ¡The ¡teams ¡in ¡Group ¡B ¡had much more ¡realistic views of the real ¡

uncertainty of the project.

  • Tworeplications in ¡real-­‑worldcontexts confirm the results of improved realism.
slide-9
SLIDE 9

11/28/15 9

So ¡what …

  • Poor communication of what is ¡meant by ¡effort estimates.
  • Poor use of uncertainty assessment methods.
  • Too ¡narrow and ¡symmetric effort intervals gives ”garbagein ¡– garbage
  • ut” ¡to ¡unceratinty assessment methods.
  • Looking back ¡on previous estimation error is ¡a ¡”simple” ¡and ¡effective

way of improvement. ¡

  • This ¡requires compentence and ¡mindsets based on probabilities and ¡

distributions.

  • A ¡long way to ¡go ...