The Southeast Asia Opportunity Trani, 12 July 2019 Alpha - - PowerPoint PPT Presentation

the southeast asia opportunity trani 12 july 2019
SMART_READER_LITE
LIVE PREVIEW

The Southeast Asia Opportunity Trani, 12 July 2019 Alpha - - PowerPoint PPT Presentation

The Southeast Asia Opportunity Trani, 12 July 2019 Alpha Investments Asia (Summary) $38k | 44k $30k | 38k 126m 51m $10k | 18k 1.4b $3k | 8k $2k | 8k 7m $1k | 7k 1.3b 53m $2k | 5k 166m $2k | 7k GDP $/capita $7k | 19k nominal | ppp 96m


slide-1
SLIDE 1

florian.weidinger@ hansabay.com florian.weidinger@ hansabay.com

1

Alpha Investments Asia (Summary)

$7k | 19k

69m

$1k | 7k

53m

$2k | 5k

166m

$2k | 8k

1.3b

$10k | 18k

1.4b

$2k | 7k

96m

$3k | 8k

7m

$1k | 4k

16m

$11k | 31k

32m

$4k | 13k

267m

$63k | 99k

6m

$3k | 9k

107m

GDP $/capita nominal | ppp population

$38k | 44k

126m

$30k | 38k

51m

Sources: Hansabay & goodfreephotos.com.

+some investment ideas to take advantage of SEA

florian.weidinger@hansabay.com

The Southeast Asia Opportunity Trani, 12 July 2019

slide-2
SLIDE 2

florian.weidinger@ hansabay.com florian.weidinger@ hansabay.com

Important Information

Important Information

This document has been prepared for investors who are legally eligible and suitable to invest in the type of investment described

  • herein. This document is for information purposes only and should not be construed as legal, tax, investment or other advice. It should

also not be construed as an offer to sell, or a solicitation of an offer to buy any product. This information is not intended to be complete or final and is qualified in its entirety by reference to detailed information upon request. Certain information contained herein constitutes forward-looking statements or estimates, however, due to actual various uncertainties and events, actual results or performance of the investment may differ materially. Investors should not rely on such forward-looking statements or estimates in making their investment decisions. Hansabay and its affiliates have no duty to update or amend such forward- looking statements or estimates. The information in this document is confidential and is intended only for the use of the person to whom it is given. The information shall not be reproduced or redistributed in any manner to any other person(s). If you have gained access to this document from any party other than Hansabay, please destroy it and all copies and provide notice to compliance@hansabay.com

2

slide-3
SLIDE 3

florian.weidinger@ hansabay.com florian.weidinger@ hansabay.com

Executive Summary

3

Alpha Investments Asia (Summary)

$7k | 19k

69m

$1k | 7k

53m

$2k | 5k

166m

$2k | 8k

1.3b

$10k | 18k

1.4b

$2k | 7k

96m

$3k | 8k

7m

$1k | 4k

16m

$11k | 31k

32m

$4k | 13k

267m

$63k | 99k

6m

$3k | 9k

107m

GDP $/capita nominal | ppp population

$38k | 44k

126m

$30k | 38k

51m

slide-4
SLIDE 4

florian.weidinger@ hansabay.com florian.weidinger@ hansabay.com

Executive Summary

4

Alpha Investments Asia (Summary)

$7k | 19k

69m

$1k | 7k

53m

$2k | 5k

166m

$2k | 8k

1.3b

$10k | 18k

1.4b

$2k | 7k

96m

$3k | 8k

7m

$1k | 4k

16m

$11k | 31k

32m

$4k | 13k

267m

$63k | 99k

6m

$3k | 9k

107m

GDP $/capita nominal | ppp population

$38k | 44k

126m

$30k | 38k

51m

Source: Hansabay & https://www.goodfreephotos.com/

slide-5
SLIDE 5

florian.weidinger@ hansabay.com florian.weidinger@ hansabay.com

▪SEA is not only a short-term winner from the trade war, but a sustainable and long- term winner

  • the investment trends have been in place way before the start of the trade war

but are now seeing a catalyst, preponing long-term growth ▪Rather than being stuck in the middle, SEA is being courted by a multipolar world

  • the investment trends have been in place way before the start of the trade war

but are now seeing a catalyst, preponing long-term growth ▪Southeast Asia is the 5th largest economy in the world, yet under-represented in global capital markets with less than 9% of the MSCI Emerging & Frontier index. ▪5k listed stocks with capital markets in transition

  • growing number of listings through e.g. IPOs
  • local bourses become sophisticated (e.g. short selling)
  • minimal and declining analyst coverage in the small/mid cap space with cheap

valuations ▪emerging & frontier Southeast Asia is entering demographic sweet spot AND a sustainable regional investment cycle

  • growth of the underlying economies through demographic dividend
  • ageing North Asia becomes an exporter of capital seeking access to cheaper

labour ▪foreign direct investment (FDI) drives sustainable regional long-term cycle

  • well-diversified source & long-term commitment (not hot money!)

Executive Summary

5

Southeast Asia is a neglected asset class in capital markets but slowly being recognized

1

Long-term trend of capital moving south sustainable and different from 1997

2

Trade war is accelerating this trend with a geostrategic dimension

3

Alpha Investments Asia (Summary)

Southeast Asia is a lost asset class yet bigger than India; corporate/FDI investors are finding out, portfolio investors not yet … and the trade war is accelerating an already

  • ngoing trend of capital flowing into the region
slide-6
SLIDE 6

florian.weidinger@ hansabay.com florian.weidinger@ hansabay.com

▪“special situation”: seek superior risk-rewards across capital structure or events:

  • trusts at discounts, preference shares, GDRs
  • holdco, credit or convertible alternative

▪“activism”: engagement with portfolio companies to achieve better corporate governance and disclosures to public investors & successfully advocate for value- creating measures ▪“discovery”: among first to invest in less covered companies for an attractive return ▪integration of responsible investing elements in process throughout (UN PRI member) ▪“we buy from local short-term investors and sell to Fidelity” – our target markets are dominated by local investors, and are growing to be attractive to foreign investors ▪very few Southeast Asia specialist investing teams around – and no one known to us employs our strategy :

  • the opportunity is bigger than India in GDP and market-terms, yet India is over-

covered ▪long-only track record of lower market correlation, down-market outperformance yet full upside capture

Executive Summary

6

niche strategy with minimal competition to take advantage of the

  • pportunity

4

absolute return/valued added investing de-risking through security selection & impact on portfolio companies/their business, not just buying paper

5

Alpha Investments Asia (Summary)

Hansabay: unique partner to access Southeast Asia with a niche public markets strategy with absolute return elements, and long history of responsible investing.

▪Hansabay is a registered fund management company, regulated by Monetary Authority

  • f Singapore
  • stable team of 4 ½ professionals managing total AUM >$100mn primarily on

behalf of family offices from Germany, Italy, Hungary, Switzerland and the US +

  • ne US institution

▪Flagship fund (Luxemburg SIF) offers monthly-to-quarterly subscription and redemptions

  • only invests in publicly traded securities

investor-ready alternative investment & and not an illiquid allocation following 6 years of building a track record as a regulated entity

6

slide-7
SLIDE 7

Southeast Asia Opportunity

1

slide-8
SLIDE 8

florian.weidinger@ hansabay.com florian.weidinger@ hansabay.com

Long-term growth in emerging & frontier Asia

8

Southeast Asia Opportunity

Sources: MSCI & Bloomberg.

IMF World Economic Outlook 2019-2024 Average Growth Rate (%)

1 2 3 4 5 6 7 8 BD CD ID MY MM PH VN TH SG CN IN LatAm SSA G7

Southeast Asia is an undiscovered and inefficiently priced asset class, featuring some

  • f the world’s most attractive long-term investment destinations such as Vietnam,

Indonesia and the Philippines.

0.8bn people $40tn MSCI market cap 2.7bn people $2.1tn MSCI market cap 0.6bn people $0.6tn MSCI market cap

~6% average long-term growth supported by positive basic balance & demographics ~1-2% and ageing education & infra challenges discovered

slide-9
SLIDE 9

florian.weidinger@ hansabay.com florian.weidinger@ hansabay.com

Southeast Asia: undiscovered large & growing economies

Southeast Asia’s almost 600mn people today generate close to $3 trillion in nominal GDP, about the size of the UK, the 5th largest economy in the world. PPP GDP is $8tn. Its MSCI market cap is only just over $600bn.

9

Southeast Asia Opportunity

$7k | 19k

69m

$1k | 7k

53m

$2k | 5k

166m

$2k | 8k

1.3b

$10k | 18k

1.4b

$2k | 7k

96m

$3k | 8k

7m

$1k | 4k

16m

$11k | 31k

32m

$4k | 13k

267m

$63k | 99k

6m

$3k | 9k

107m

GDP $/capita nominal | ppp

Sources: Hansabay estimates based on MSCI, Bloomberg, World Bank data.

population

$38k | 44k

126m

$30k | 38k

51m

slide-10
SLIDE 10

florian.weidinger@ hansabay.com florian.weidinger@ hansabay.com

An active value investor’s playground

10

All Share Data MSCI Analyst Ratings # Firms Mkt Cap % rep in MSCI Traded Value avg rating per stock % no rating $bn $mn TH 794 $533 23% $1,699 4 28% PH 266 $269 22% $141 5 53% ID 649 $505 22% $623 5 49% MY 944 $419 28% $573 3 72% SG 649 $583 31% $840 2 22% VN 1,565 $191 10% $136 1 68% BD 312 $35 9% $66 1 86%

Sources: Hansabay estimates based on MSCI, Bloomberg, World Bank data.

Southeast Asia Opportunity

slide-11
SLIDE 11

florian.weidinger@ hansabay.com florian.weidinger@ hansabay.com

Hansabay’s typical target universe is historically cheap Real Yields are moderately higher, and less affected by central banks – should attract capital; Asian countries with low real yields are at least high growth

Why Asia Now?

11

Southeast Asia Opportunity

Sources: (1) ASEAN; (2,3) Bloomberg.

emerging & frontier Asia is entering demographic sweet spot AND a sustainable regional investment cycle

1 2 3

0.70 0.75 0.80 0.85 0.90 0.95 1.00 1.05 Inbound FDI into ASEAN by source country ($bn) Small/Large Cap Index in Asia (x)

  • 3.0
  • 1.5

0.0 1.5 3.0 4.5 6.0 7.5 9.0 ID IN CN MY PH VN TH US DE CPI Real Yield Nominal Yield 5 Year Bond Yields & Inflation Rates (%) 0.0 10.0 20.0 30.0 40.0 intra JP CN KR US EU RoW FDI 2007 FDI 2017

slide-12
SLIDE 12

florian.weidinger@ hansabay.com florian.weidinger@ hansabay.com

“the most interesting sub-asset class in global equities”

12

Southeast Asia Opportunity

Sources: MSCI & Bloomberg.

Price-to-Earnings Ratios of MSCI Small Cap Indices

50% 75% 100% 125% 150% 5.0x 7.5x 10.0x 12.5x 15.0x 17.5x 20.0x PH ID TH MY VI SG CN JP KR IN EU US

Small-Cap Southeast Asia is cheap in absolute and relative terms:

  • ther than China, the only region where higher growth small caps are a bargain
  • ne of the few regions not to have rallied hard these past few years, not benefitting

from synchronized money printing

MSCI small cap P/E multiple ratio of small/large cap P/E multiple

zone of opportunity

slide-13
SLIDE 13

Capital Flowing South

2

slide-14
SLIDE 14

florian.weidinger@ hansabay.com florian.weidinger@ hansabay.com

China Japan India Indonesia Malaysia Philippines Thailand Vietnam Korea Bangladesh Myanmar

The “demographic sweet spot”

14

Capital Flowing South

Sources: UN.

Years during which percentage of population aged 0-14 below 30% & population aged 65+ below 15%

Southeast Asia has the necessary threshold conditions in hard (e.g. electricity generation) and soft (e.g. education levels) infrastructure to capitalize on its young populations – in the form of dramatic rises in FDI inflows, more and better jobs, urbanization and growing domestic economies. 7

Seven southeast Asian nations in top-35 countries for ease of getting electricity as a business

8th

Vietnam PISA rank for 15yr

  • lds science scores, out of 72

countries

1 1 1 1 1 1 1 1 1 1 1 1 1 1 1 1 1 1 1 1 1 1 1 1 1 1 1 1 1 1 1 1 1 1 1 1 1 1 s 1 1 1 1 1 1 1 1 1 1 1 1 1 1 1 1 1 1 1 1 1 1 1 1 1 1 1 1 1 1 h 1 1 1 1 1 1 1 1 1 1 1 1 1 1 1 1 1

1985 1990 1995 2000 2005 2010 2015 2020 2025 2030 2035 2040 2045 2050 2055 2060 2065 2070 2075

“good enough” infrastructure to facilitate development

20 40 60 80 100 CN IN ID JP MY PK PH SG SK TW TH VN Educational Attainment % of 15+ population with at least primary education Older net saver countries start exporting capital to younger economies

slide-15
SLIDE 15

florian.weidinger@ hansabay.com florian.weidinger@ hansabay.com

20 40 60 80 100 120 140 1995 1996 1997 1998 1999 2000 2001 2002 2003 2004 2005 2006 2007 2008 2009 2010 2011 2012 2013 2014 2015 2016 2017

The long-term money has noticed, the short-term one hasn’t

15

Capital Flowing South

Sources: ASEAN, World Bank.

Foreign Direct Investment (FDI) drives sustainable regional long-term cycle, growing in size …

Southeast Asia has been discovered by the conglomerates and industrial players of the world, increasingly so also from North Asia – but portfolio investors i.e. fund managers and banks are still massively underweight the region and ignoring the asset class

… while portfolio investors have not participated in a major way so far

  • 20
  • 10

10 20 30 40 50 60 70 80 1994 1995 1996 1997 1998 1999 2000 2001 2002 2003 2004 2005 2006 2007 2008 2009 2010 2011 2012 2013 2014 2015 2016 2017 aggregate portfolio investment into ASEAN countries ($bn) inbound FDI into ASEAN ($bn)

$120bn p.a. and growing $30-40bn p.a. on average and erratic, mostly bank loans

slide-16
SLIDE 16

Southeast Asia & The Trade War

3

slide-17
SLIDE 17

florian.weidinger@ hansabay.com florian.weidinger@ hansabay.com

20 40 60 80 100 120 140 1995 1996 1997 1998 1999 2000 2001 2002 2003 2004 2005 2006 2007 2008 2009 2010 2011 2012 2013 2014 2015 2016 2017

Trade & Tech War is accelerating an existing trend

17

Southeast Asia & The Trade War

Sources: ASEAN, World Bank & https://www.goodfreephotos.com/

Foreign Direct Investment (FDI) drives sustainable regional long-term cycle, growing in size …

inbound FDI into ASEAN ($bn)

$120bn p.a. and growing

slide-18
SLIDE 18

florian.weidinger@ hansabay.com florian.weidinger@ hansabay.com

Examples of trade-war related business activity
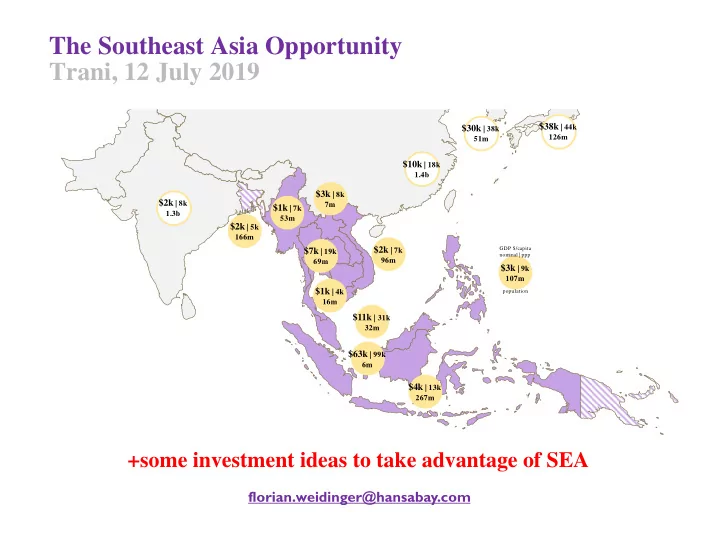
18

Southeast Asia & The Trade War

Sources: ASEAN, World Bank. ▪ Amata (AMATA TB, $750mn, 15x P/E, 1.9x P/B) ▪ a major Thai industrial park operator reporting more than 80% of 2018 bookings to have originated from Chinese businesses re-locating production, supporting

  • verall growth in excess of 20% for the year

▪ Sritex (SRIL IJ, $500mn, 7x P/E) ▪ fully integrated midstream textile company with capacities from upstream to midstream (yarn, greige, fabric and garment) ▪ exported sales have doubled from 2016 to 2018 ▪ SITC (1308 HK, $2.6bn, 13x P/E) ▪ regional intra-Asian integrated logistics shipping company, most significant player with feeder-size fleet to access secondary ports in Southeast Asia ▪ opening a new shipping route every month currently ▪ Integra Cabinet (WOOD IJ, $380mn, 19x P/E) ▪ forestry segment recorded >150% growth in 2018 revenue as the company leveraged on the implementation of anti-dumping and anti-subsidy duties ▪ Bekasi Fajar (BEST IJ, $160mn, 7x P/E & 0.7x P/B) ▪ a major Indonesian industrial park operator strongly geared towards Japanese FDI investment ▪ Phu Tai Corp (PTB VN, $130mn, 8x P/E) ▪ is a conglomerate, manufacturer stone & wood products,

  • verseas clients like Walmart, Carrefour and Kingfisher

▪ US contribution to its furniture segment's export sales has increased from 25pct in 2017 to 40pct in 2018 ▪ Noibai Cargo (NCT VN, $80mn, 8x P/E, 14% div yield) ▪ ground cargo handling at Noibai airport in Vietnam, majority-owned by Vietnam Airlines ▪ Kelington Group (KGRB MK, $80mn, 18x P/E) ▪ gas delivery systems for industrial plants ▪ beneficiary of China’s push to build up semiconductor capacity as a hedge against the tech war

slide-19
SLIDE 19

florian.weidinger@ hansabay.com florian.weidinger@ hansabay.com

Macro data evidence so far …

19

Southeast Asia & The Trade War

Sources: Maybank based on ITC data.

slide-20
SLIDE 20

florian.weidinger@ hansabay.com florian.weidinger@ hansabay.com

… and we haven’t even started yet

20

Sources: Nikkei Asian Review.

Southeast Asia & The Trade War

slide-21
SLIDE 21

Portfolio

4

slide-22
SLIDE 22

florian.weidinger@ hansabay.com florian.weidinger@ hansabay.com

▪ seek superior risk-rewards across capital structure ▪ trusts at discounts, preference shares, GDRs ▪ holdco, credit or convertible alternative ▪ engagement with portfolio companies to achieve better corporate governance and disclosures to public investors ▪ successfully advocate for value-creating measures ▪ systematic investment process to discover Emerging Asian “J-curve” companies ▪ our portfolio and idea pipeline is typically very different from most funds covering the region ▪ we specifically seek to invest time and money where we find fewer of our peers ▪ incorporation of ESG elements part of the investment process ▪ mindful of potential to create impact ▪ committed to corporate governance ▪ business decisions in developing countries affect poor people ▪ we know our businesses in detail and typically invest for a long time frame ▪ adherence to internally developed frameworks emphasizing factors that make an Asian investment successful and that avoid value traps and frauds

Asia Public Markets: what we do & how we are different

22

differentiated portfolio of shares and bonds issued by companies, of all sizes,

  • perating in emerging Asia

1

executing a methodology to access Asian growth, hopefully avoiding the traps

2

valued added investing de-risking through security selection & impact on portfolio companies and their business, not just buying a piece of paper

3

Classification MY Consumer MY Insurance ID Consumer Fin PH Diversified PH Food PAN Animal Feed CN eCommerce CN Internet search Bangladesh Pharma PAN Dairy TH Property TH Infra ID Infra ID Tourism PH Diversified CN Waste Water CN Tap Water CN Infra/Enviro CN Waste Treatment CN Media TH Consumer IN Healthcare PAN Insurance CN Pharma Distr. MM Diversified ID Media (Bonds) PAN Fish (Bonds) MM Diversified VN Fund KR Pref Fund Asia Success Factors sophistication or adoption curve Led by e used car PartnersPhils con protein s Largest 80% mar Top 3 ph dairy One of tinfra inte Rising m Largest Know-hTailwind Upgradin Owned b yes, in pOne of tLong his Largest consume TV sets Fishing telco biz resilient volume trend yes Low pen protein protein s Rapid gr Top lineContinue dairy Rising uinfra invprivate p Small % Power bsewage Growing Yes, give Tailwind it's a que Low pen Steadily Ageing consume tv adver VN cons unique role in a country One of twheat te Largest Dominan dairy op private s One of t Only list In line w Outdoor Providin Only nat broadcas telco net multi-country success, export discipline Operates Exposure Exposur China an Wholesa Exports t dairy op export d Insuranc Fishing success independent of politics RelativeYes LTVs etc
  • nly min
yes not foundati it will doIndepenPotentia SomewhRelativeRelativel yes Yes, alth yes not t Relativetheoretic pricing power to mitigate FX and currency Potentia yes thanks to typically Yes, it doesn’t hold inventory risk No fx ris fixed maYes, tick Prices infixed mar No fx risDomestiDepends No fx ris No, altho track rec tower bi cash generation evidence Generate div yield Growingyes divsdivs Yes, ope v cash gyes divs and also very dividend CFO is sGenerate Ability tAble to Generate Able to Able to GrowingGenerati fcf yield prior sector case study in EM Yes: ChiAIA eg Indiayes CPF in TH JD.com, Google, Mega lif yes yes yes China Ev Planb M Apollo H Yes, GreKalbe Fa ABN in P Thai, Ind Thai, Ind yes professional mgt or 1st gen entrepreneur ProfessiFounded yes yes US educJack MaRobin Li divs and Owned b entrepre Family oProfessi Founder Founder 1st gen Professinew man Yes Respecte One of thave sta ex CLSA management incentives/owner commitment Mgmt te yes Founder Robin Li Majorly wealth c Family oLopez fa Founder The ChaThe 2 ch REIT str Sinopha warrants investor relations strategy genuine Seems o yes yes Met CFO Yes very ope very wel IR team yes yes, Dominic, the yes yes Yes yes Asia Risk Mitigants Quality JV partners Mazda Singtel f Itochu Suning, divs and Carlson, China Ev US manu Fosun PMitsubis Apollo Te PE Investors IFC SIIC in pay TV TPG CG focussed shareholders yes Professi Robin Li Good tra Aberdee Strong b IFC Professi Wasatch Professio Aberdee MDB vetting IFC ADB, IFIFC ADB an History Berjaya Asia CriLong his Long his Track reLong his Long lisreliable r Owned b Long his >10y list10y listeThe firstLong his AffiliateLong his cleanest Fund Flow vulnerability low High liqu does noLow, as Phils con does not Low, as Highly li safe havHigh liqonly rece Sufficien safe havLow, as Liquidity Low, witPotentianot a maYes Low, as Very liqu less expo shares ano Hansabay Investing Philosophy research capability yes yes yes yes yes yes yes yes yes yes yes yes yes yes yes yes yes yes yes yes yes Yes yes yes yes, hav Yes yes yes positive ESG effort CSR acti yes CP Grouyes yes SR SR SR ReducinSR yes yes Operates yes Yes yes yes yes market structure favourable Dominat yes Regulate market s Dominan Yes, seaGeneric d NZ dairy
  • nly two
virtuallyMany sm Dominatlarge weyes yes Further c Still a fra no2 play Yes yes, as A Huge comay be o CA capability Strong m Able to r yes Its holdicontractrelative s Strong b Ability t Long his growth o IT systeExecutioPlanning ScalabiliPartnersStrong m Good rel EconomLarge ins position CA positional ExclusivRise in b Its holditerminal Monopo Strong s NZ dairy Industry project tterminal geograpMonopo 10% mar Strong p Good rel brand an brand an
  • nly plafirst mov
existing stability of sales mgt conConglo s given robedrock Yes, with Yes, with Growingyes Yes, as d concessYes, for Depends Stable Relative Defensiv Half of aPharma d can cont contract reinvestment returns >= ROIC Yes, RO still 18%yes identified yes Yes Yes industria Somewh yes, ROE yes Yes, whe yes with exis yes Yes, goo Share Data number of analyst ratings 5 6 2 12 1 4 47 34 1 8 23 4 14 1 2 4 3 14 7 1 3 4 24 19 4 1 Last Analyst Report Oct-15 Nov-15 Nov-15 Nov-15 Oct-15 Nov-15 Nov-15 Nov-15 Nov-15 Oct-15 Nov-15 Aug-15 Sep-15 Nov-15 Sep-15 Aug-15 Nov-15 Oct-15 Nov-15 Aug-15 Nov-15 Nov-15 Nov-15 Nov-15 Nov-15 Nov-15 na na na na researching since 2014 2013 2012 2011 2012 2011 2014 2015 2015 2005 2015 2015 2011 2014 2013 2014 2014 2012 2015 2014 2013 2013 2014 2015 2011 2013 2013 2013 2006 2013 market cap $bn 0.6 0.2 0.1 9.7 0.5 2.5 204.3 71.6 0.2 6.2 0.7 0.1 1.8 0.0 0.7 1.3 0.8 1.2 0.8 0.6 0.1 0.6 75.3 11.9 0.6 0.0 0.0 0.0 valuation 2015 P/E P/E P/B NAV EV P/E P/E PE PE EV NAV EV P/E P/E EV P/E P/E P/E EV EV P/E div P/E P/E P/E yld yld NAV NAV disc 10.8 14.1 0.3
  • 9%
2.4 10.6 31.4 29.4 8.9 8.7
  • 30%
11.4 22.8 11.5
  • 24.2
14.9 12.2 12.2
  • 11.8
7.7 20.5 20.5 46.0 37% 41% 20% 0%
  • 38%
ROCE LTM/estimate 123
  • 13
5 18 16 28 54 10 6 7 50 10 12 7 6 7 14 15 19 16 9
  • 11
8 Net Margin 3yr average/last year 9 22 38 10 4 4 34 36 14 2 17 11 3 2 3 32 12 16 30 13 7 19 14 1 22

Alpha Investments Asia (Portfolio)

we have a track record in sustainable investing and we understand the communities we operate in

4

Sources: (1) CLSA; (2,3) Hansabay; (4) UN PRI.

slide-23
SLIDE 23

florian.weidinger@ hansabay.com florian.weidinger@ hansabay.com

23

Alpha Investments Asia (Portfolio)

Highly Differentiated Pan-Asian Portfolio

* = Pan-Asian Businesses D

A S

Insurance (HK*) Aircraft Maintenance (PH) D LPG Distribution (PH)

D A

Supermarket (PH)

S A S

Tourism (ID)

D A

Industrial Gas (ID)

A

Diversified (MM) Healthcare (BD)

D

Agriculture (VN) Consumer Credit (ID) Food Ingredients (TH*) Fish (SG*) Materials (PH) S

S

Tourism (MM)

D A

Materials (VN) Tourism (VN)

D

D

S

Construction (ID)

S D S A

Retail (MY*)

A

Construction (TH)

D A

Air conditioners & Elevators (PH) D Media (ID)

S A

Demographics-led Themes: Food/Protein/Water + Consumption + Infrastructure

Tea(HK*)

Activist Special Sit Discovery

D S

Note: portfolio is non-exhaustive.

slide-24
SLIDE 24

florian.weidinger@ hansabay.com florian.weidinger@ hansabay.com

Portfolio Highlight: Cosco Capital

Philippines / consumer

Alpha Investments Asia (Portfolio)

Rationale Description & Rationale 24

Assumptions:

  • Puregold: 51% current market cap
  • Property: see Note 30 in 3Q17 Report
  • Liquor distribution: at 10x LTM EBITDA

based on comparables

  • Specialty Retail: Liquigaz at 10x LTM

EBITDA based on comparables

(market cap) (book value) appraised: 35.0bn! (10x LTM ebitda) (30 Sep) +45% to PGOLD >120-170% to sum of the parts plans for investment in Specialty Retail new: Personal Care new: DIY and building products

Net income 5.8bn 1.05bn 0.61bn 0.43bn EBITDA 10.4bn 1.35bn 0.98bn 0.82bn Revenue 121.4bn 2.25bn 6.26bn 12.95bn

(30 Sep) (market cap)

% share of sales to consumers (end market)

Sources: Company and Hansabay unless stated.

A S

35bn? >13bn!

9x P/E

slide-25
SLIDE 25

florian.weidinger@ hansabay.com florian.weidinger@ hansabay.com

Portfolio Highlight: MNC

Indonesia / media: MNCN IJ equity and BHITIJ credit

Rationale Description

Alpha Investments Asia (Portfolio)

70%

TV set penetration in Indonesia, with advertising rate cards at % discount to the Philippines

>18%

25

Dominant media conglomerate (simplified structure)

Sources: Company and Hansabay estimates unless stated. Outdated as it reflects the set-up of the investment. MNC Bhakti Investama mv $292mn net debt $1,018mn (entity) / $1,796mn (consolidated) Global Mediacom (53%) mv $449mn net debt $316mn (entity) net debt $722mn (conso) MNC Land (26%) mv $697mn net debt $214mn

#1

in free-TV and pay-TV with 35-40% and 70% market shares

MNCN (66%) free-TV mv $1,278mn net debt $266mn MSKY (69%) pay-TV mv $632mn net debt $140mn Ottawa Holding $231mn 2021 Bonds MNC Kapital (88%) mv $655mn

$mn Pledged Global Mediacom shares 96 Pledged MNC Land shares 12 Recovery Value on Pledged only 108 0.5x covered Unsecured claim Mediacom 28 Unsecured claim Other Investama 131 Unsecured claim Land 38 Recovery Value on see-through 306 1.3x covered 2018 Bonds Outstanding 231

Illustrative Recovery Analysis Other value est. $50mn

yield to maturity to 2018 in USD, creating an equity-like return

1.3x

Theoretical further downside protection in USD based on value of unsecured claim; current value partially protected by share pledge in Singapore

A S

9x P/E

slide-26
SLIDE 26

florian.weidinger@ hansabay.com florian.weidinger@ hansabay.com

Portfolio Highlight: Macroasia

Philippines / infrastructure

Alpha Investments Asia (Portfolio)

Rationale 26

Sources: Company and Hansabay unless stated.

A S

Rationale Description

25x 49% 16k

not cheap but “quality/growth at an acceptable price” stake in Lufthansa Technik Philippines delivers German MRO quality/standard/brand with Western governance – but less in focus as associate income 16k deliveries in Asia over next 20 years

  • vs. current fleet of 7k (vs 3k 10 years ago)
slide-27
SLIDE 27

florian.weidinger@ hansabay.com florian.weidinger@ hansabay.com

$7k | 19k

69m

$1k | 7k

53m

$2k | 5k

166m

$2k | 8k

1.3b

$10k | 18k

1.4b

$2k | 7k

96m

$3k | 8k

7m

$1k | 4k

16m

$11k | 31k

32m

$4k | 13k

267m

$63k | 99k

6m

$3k | 9k

107m

GDP $/capita nominal | ppp population

$38k | 44k

126m

$30k | 38k

51m

Thank You!

27

Appendix

20 40 60 80 100 120 140 1995 1996 1997 1998 1999 2000 2001 2002 2003 2004 2005 2006 2007 2008 2009 2010 2011 2012 2013 2014 2015 2016 2017

$120bn p.a. and growing

slide-28
SLIDE 28

Appendix

5

slide-29
SLIDE 29

florian.weidinger@ hansabay.com florian.weidinger@ hansabay.com

Portfolio Highlight: San Miguel Pure Food

Philippines / diversified food conglomerate

Appendix

#1/#2

market positions for its consumer brands and for its commercial agro-industrial business

asset light

vertically integrated but contracted out farming

  • perations

Rationale Description

4x

2015 ebitda entry-valuation (low valuation highlighted by non-core disposals and refinancing of previously punitive preferred shares)

29

Agro Industrial Value-added Foods Flour Milling Other 42% 23% 29% 7%

(est. 2014 operating profit share)

CPF

CP Foods case study in Thailand coming true in the Philippines with PureFoods

Sources: Company and Hansabay unless stated. 20 40 60 80 100 120 Nov-12 Jan-14 Feb-15 Apr-16 May-17 Jul-18

D A S A S D Activist Special Sit Discovery

slide-30
SLIDE 30

florian.weidinger@ hansabay.com florian.weidinger@ hansabay.com

$0.0bn $0.5bn $1.0bn $1.5bn $2.0bn $2.5bn $40mn per 1% $50mn per 1% $60mn per 1% $70mn per 1% $80mn per 1% $90mn per 1% $100mn per 1% $110mn per 1% $120mn per 1% COP non-COP

Portfolio Highlight: CFG Investment SAC (Bond)

Singapore / pan-Asian fishery business (distressed situation)

Rationale Description

Appendix

>20%

expected yield, creating an equity-like return in bonds pari passu with bank debt 1.2x MM if distressed situation realized within next twelve months as expected

30

Alaska Pollock as a former equity holder of the Peruvian-Chinese business, we have very high conviction in the value

  • f the former Copeinca (COP) assets

Peruvian Anchovy

Access to quota-based supply of highly strategic fish species

Illustrative Recovery Analysis Sources: Company and Hansabay unless stated.

Anchovy business owns 17% of Pacific fishing quota, valued typically at around $100mn per 1% end-market is China domestic consumption of aquaculture and some hog products

debt out (at par) prior quota M&A Copeinca enterprise value senior bonds outstanding (at par)

A S

slide-31
SLIDE 31

florian.weidinger@ hansabay.com florian.weidinger@ hansabay.com

Portfolio Highlight: Beximco Pharma

Bangladesh / healthcare

Appendix

55,000

#2 pharma company selling to fragmented market

  • f 55,000 pharmacies

quality

Rationale Description

7x

P/E entry valuation into our position due to security selection of depositary receipts at a c. 60% discount

31

growth

experienced management and the largest white collar employer in Bangladesh Export revenue opportunity following regulatory approval drive: first Bangladeshi company to export to US under FDA license

Sources: Company and Hansabay unless stated.

95 215 126 308 304 Bangladesh India Pakistan Vietnam Sri Lanka

Annual Healthcare Expenditure per capita

branded generics analgesics contract/export manufacturing injectables D S

slide-32
SLIDE 32

florian.weidinger@ hansabay.com florian.weidinger@ hansabay.com

Portfolio Highlight: Myanmar Investments

Myanmar / diversified

Rationale Description

Appendix

32

Sources: Company and Hansabay unless stated.

MIL investment is a chance to invest in a very compelling medium- term growth profile (Myanmar cell towers) with a low risk off-take (Telenor and Ooredoo), experienced management (ex Orange CEO/Eaton Towers founder) and a co-shareholder interested in value creation and eventually an exit (TPG), with low transaction costs and high convenience (through existing listing) + access to attractive pipeline of other investments accessing Myanmar’s growth (e.g. MFIL microfinance, e.g. healthcare)

Myanmar is the second largest land mass in Southeast Asia (653,290 sq. km), with the 5th largest population (51mn), with 34% urban population, and 13% in large cities (>200k)

Lowest nominal GDP/capita (~$1,000) in SE Asia, but growing rapidly at 8.5% in 2014, and >7% p.a. since the dissolution of the military junta in 2010 Country Portfolio Company

$50mn holding company, second largest for Burma/Myanmar

aim to grow asset base and market cap substantially with deal pipeline

70%

mobile penetration still very low, i.e. Myanmar telecoms is a compelling greenfield opportunity, with a low risk anchor client in Norway’s Telenor country is more strongly endowed in natural resources than its comparable and neighbor Thailand, and at a highly strategic location, attracting the interest of China, India and the US.

A S

slide-33
SLIDE 33

florian.weidinger@ hansabay.com florian.weidinger@ hansabay.com

Portfolio Highlight: ASEAN cement minorities event-driven

ASEAN / materials

Appendix

33

Sources: Company and Hansabay unless stated.

S

500 1,000 1,500 2,000 2,500 Jul-18 Sep-18 Dec-18 Mar-19 5 10 15 20 Jul-18 Sep-18 Dec-18 Mar-19 1 2 3 4 Jul-18 Sep-18 Dec-18 Mar-19 key insight: when a foreign-listed subsidiary of a multinational is sold, the purchaser pays the present value of future cash flows without the license fee expense that the public market valuation of course discounts. For a low 3-5% net margin business like cement, the effect can be dramatic

… successfully applied to the Philippines & Malaysia Holcim Indonesia case study …

2018: LafargeHolcim sold Holcim Indonesia for a 270% premium LafargeHolcim sold Holcim Philippines for a >100% premium LafargeHolcim sold Lafarge Malaysia for a >100% premium $215 EV/ton EV/EBITDA 23x $107 EV/kg EV/EBITDA nm

LafargeHolcim had two other listed subsidiaries in Southeast Asia remaining, both undervaluing M&A scenarios

slide-34
SLIDE 34

Republic Plaza, 57th floor 9 Raffles Place, Singapore 048619 Tel +65 68 231 448 florian.weidinger@hansabay.com