
SLIDE 1
The Scottish Borders An Introduction March 2017 2015 Population - - PowerPoint PPT Presentation
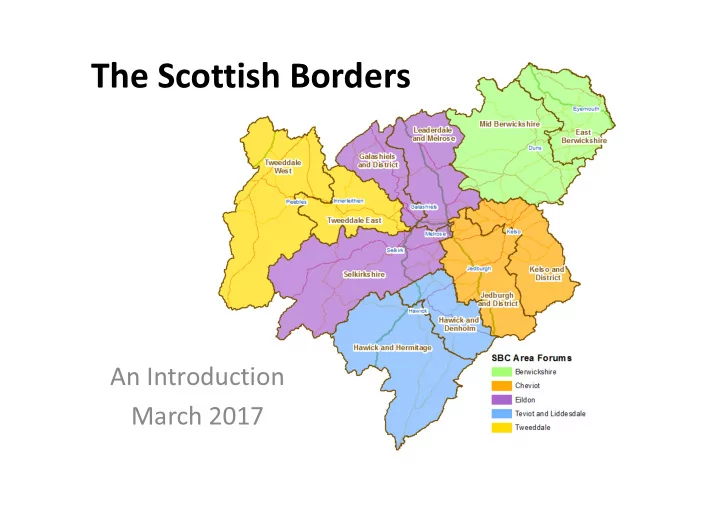
The Scottish Borders An Introduction March 2017 2015 Population Total % % Working % Pension Area Forum / Ward Children Working Age Pension Age Population Children Age Age Berwickshire 3,332 12,268 5,227 20,827 16% 59% 25% East
Area Forum / Ward Children Working Age Pension Age Total Population % Children % Working Age % Pension Age Berwickshire 3,332 12,268 5,227 20,827 16% 59% 25% East Berwickshire 1,745 6,243 2,603 10,591 16% 59% 25% Mid Berwickshire 1,587 6,025 2,624 10,236 16% 59% 26% Cheviot 2,987 11,273 5,254 19,514 15% 58% 27% Jedburgh and District 1,419 5,384 2,394 9,197 15% 59% 26% Kelso and District 1,568 5,889 2,860 10,317 15% 57% 28% Eildon 5,968 21,718 7,349 35,035 17% 62% 21% Galashiels and District 2,419 9,555 2,658 14,632 17% 65% 18% Leaderdale and Melrose 2,046 6,439 2,294 10,779 19% 60% 21% Selkirkshire 1,503 5,724 2,397 9,624 16% 59% 25% Teviot and Liddesdale 2,824 10,566 4,416 17,806 16% 59% 25% Hawick and Denholm 1,665 5,503 2,117 9,285 18% 59% 23% Hawick and Hermitage 1,159 5,063 2,299 8,521 14% 59% 27% Tweeddale 3,864 12,482 4,502 20,848 19% 60% 22% Tweeddale East 2,107 6,343 2,355 10,805 20% 59% 22% Tweeddale West 1,757 6,139 2,147 10,043 17% 61% 21% Grand Total 18,975 68,307 26,748 114,030 17% 60% 23%
Data Zone Name Children Working Age Pension Age Total Population % Children % Working Age % Pension Age Bonchester Bridge and Chesters Area 83 421 233 737 11.3% 57.1% 31.6% Denholm 87 349 205 641 13.6% 54.4% 32.0% Hawick - Burnfoot - Central 220 447 98 765 28.8% 58.4% 12.8% Hawick - Burnfoot - North 275 516 63 854 32.2% 60.4% 7.4% Hawick - Burnfoot - South East 152 438 153 743 20.5% 59.0% 20.6% Hawick - Burnfoot - West 138 373 106 617 22.4% 60.5% 17.2% Hawick Central - Drumlanrig 161 582 249 992 16.2% 58.7% 25.1% Hawick Central - Millers Knowes 113 515 234 862 13.1% 59.7% 27.1% Hawick Central - Town Centre 81 457 221 759 10.7% 60.2% 29.1% Hawick Central - Trinity 81 385 172 638 12.7% 60.3% 27.0% Hawick Central - Weensland 137 528 242 907 15.1% 58.2% 26.7% Hawick Central - Wellogate 117 598 218 933 12.5% 64.1% 23.4% Hawick North - Commercial Road 93 432 194 719 12.9% 60.1% 27.0% Hawick North - Silverbuthall 153 549 175 877 17.4% 62.6% 20.0% Hawick North - Stirtches 168 579 173 920 18.3% 62.9% 18.8% Hawick North - Wilton Hill 139 579 238 956 14.5% 60.6% 24.9% Hawick West End - Crumhaugh 98 527 301 926 10.6% 56.9% 32.5% Hawick West End - Crumhaughill and Parkdaill 145 475 217 837 17.3% 56.8% 25.9% Hawick West End - Wilton Dean 60 304 219 583 10.3% 52.1% 37.6% Minto Cauldmill and Boonraw Area 97 516 260 873 11.1% 59.1% 29.8% Newcastleton 103 430 231 764 13.5% 56.3% 30.2% Teviothead and Hermitage Area 123 566 214 903 13.6% 62.7% 23.7% Teviot and Liddesdale 2824 10566 4416 17806 15.9% 59.3% 24.8%
Population and Deprivation Economy and Income Education and Learning Health and Wellbeing
Community and Environment
Public Services
Theme
Demographic and Household Profile Population and Household Profile with Deprivation 'baseline' SIMD2012 Economy and Income 1 We live in a Scotland that is the most attractive place to do business in Europe 2 We realise our full economic potential with more and better employment opportunities for our people Education and Learning 3 We are better educated, more skilled and more successful, renowned for our research and innovation 4 Our young people are successful learners, confident individuals, effective contributors and responsible citizens Life Stages / Health and Wellbeing 5 Our children have the best start in life and are ready to succeed 6 We live longer, healthier lives 7 We have tackled the significant inequalities in Scottish society 8 We have improved the life chances for young people and families at risk 15 Our people are able to maintain their independence as they get older and are able to access appropriate support when they need it Community and Environment 9 We live our lives safe from crime, disorder and danger 10 We live in well-designed, sustainable places where we are able to access amenities and services we need 11 We have strong, resilient and supportive communities where people take responsibility for their own actions and how they affect others 12 We value and enjoy our built and natural environment and protect and enhance it for future generations 13 We take pride in a strong, fair and inclusive national identity (Local identity) 14 We reduce the local and global environmental impact of our consumption and production Public Services 16 Our public services are high quality, continually improving, efficient and responsive to local people's needs
0 - 14 15 - 29 30 - 44 45 - 59 60 - 74 75 + Scottish Borders 15.5% 14.5% 15.7% 23.7% 20.3% 10.2% Scotland 15.9% 19.3% 18.9% 21.7% 16.0% 8.1% 0.0% 5.0% 10.0% 15.0% 20.0% 25.0%
Proportion of 2015 Population by Age Group for the Scottish Borders compared to Scotland, NRS
0 - 14 15 - 29 30 - 44 45 - 59 60 - 74 75 + Females 8,733 8,259 9,472 13,741 11,837 6,715 Males 8,984 8,308 8,476 13,246 11,317 4,942 All 17,717 16,567 17,948 26,987 23,154 11,657 5,000 10,000 15,000 20,000 25,000 30,000 5,000 10,000 15,000 20,000 25,000 30,000
Estimated Population for the Scottish Borders by Gender and Age Group for 2015, NRS
114,030
Aged 60+
30.5%
1.4% 4.2% 5.6% 9.1% 20.3% 16.1% 23.8% 9.8% 6.3% 3.5% 10% 10% 10% 10% 10% 10% 10% 10% 10% 10% 0.0% 5.0% 10.0% 15.0% 20.0% 25.0% 1 - Most Deprived 2 3 4 5 6 7 8 9 10 - Least Deprived
Percent Datazones by SIMD2016 Decile: Scottish Borders vs. Scotland
Scottish Borders Scotland
4.5% 18.2% 13.6% 9.1% 18.2% 13.6% 13.6% 9.1% 0.0% 0.0% 1.4% 4.2% 5.6% 9.1% 20.3% 16.1% 23.8% 9.8% 6.3% 3.5%
0.0% 5.0% 10.0% 15.0% 20.0% 25.0% 1 - Most Deprived 2 3 4 5 6 7 8 9 10 - Least Deprived
Percent of Datazones by SIMD2016 Decile: Teviot and Liddesdale vs. Scottish Borders
Teviot and Liddesdale Scottish Borders
Data Zone Name / SIMD2016 Overall Decile Income decile Employment decile Health decile Education decile Housing decile Access decile Crime decile Bonchester Bridge and Chesters Area 6 7 8 6 9 9 1 10 Denholm 7 6 7 8 6 7 7 10 Hawick - Burnfoot - Central 1 1 2 1 1 2 3 2 Hawick - Burnfoot - North 2 1 2 2 1 4 3 2 Hawick - Burnfoot - South East 2 2 2 2 1 5 3 2 Hawick - Burnfoot - West 2 2 2 2 1 4 2 4 Hawick Central - Drumlanrig 5 5 5 4 5 8 4 6 Hawick Central - Millers Knowes 8 8 6 7 6 9 6 7 Hawick Central - Town Centre 4 4 3 4 4 6 10 2 Hawick Central - Trinity 3 4 3 4 5 4 8 2 Hawick Central - Weensland 6 6 6 6 6 9 4 6 Hawick Central - Wellogate 2 3 1 2 3 5 9 2 Hawick North - Commercial Road 3 3 2 3 3 6 8 3 Hawick North - Silverbuthall 4 4 3 4 5 8 3 6 Hawick North - Stirtches 5 6 6 4 5 8 2 8 Hawick North - Wilton Hill 5 5 3 5 6 8 4 6 Hawick West End - Crumhaugh 3 3 3 2 4 7 8 4 Hawick West End - Crumhaughill and Parkdaill 8 8 6 7 7 8 5 7 Hawick West End - Wilton Dean 7 7 6 7 8 9 2 8 Minto Cauldmill and Boonraw Area 7 8 9 7 8 10 1 9 Newcastleton 6 5 4 8 6 9 10 7 Teviothead and Hermitage Area 5 5 6 7 7 7 1 7
2004 2005 2006 2007 2008 2009 2010 2011 2012 2013 2014 Scottish Borders (GVA per Capita) £12,592 £13,034 £14,124 £14,728 £14,944 £14,493 £14,927 £15,460 £15,424 £16,318 £17,180 Scotland (GVA per Capita) £17,229 £18,263 £19,377 £20,212 £20,661 £20,679 £20,458 £20,809 £21,190 £22,174 £23,102 UK (GVA per Capita) £18,732 £19,744 £20,745 £21,708 £22,152 £21,659 £22,271 £22,806 £23,323 £24,131 £24,958 £0 £5,000 £10,000 £15,000 £20,000 £25,000 £30,000 GVA per Capita
Gross Value Added (GVA) per Capita 2004 to 2014 for Scottish Borders, Scotland and UK, ONS
increased by £313 million a 10.9% increase above the 1.3% increase for Scotland. (Note this excludes financial and insurance enterprises)
to more of the turnover relative to Scotland.
1,445 924 814 646 641 621 599 421 311 Town Average: 713 200 400 600 800 1,000 1,200 1,400 1,600 Melrose Peebles Kelso Galashiels Eyemouth Jedburgh Duns Selkirk Hawick
Average Weekly Footfall in 2015 per 1000 Town Population, SBC and NRS
2002 2003 2004 2005 2006 2007 2008 2009 2010 2011 2012 2013 2014 2015 2016 Residence Based £329 £343 £356 £370 £385 £423 £450 £437 £460 £453 £451 £508 £490 £503 £499 Workplace Based £288 £306 £324 £329 £346 £381 £370 £381 £418 £398 £403 £452 £456 £455 £453 £0 £100 £200 £300 £400 £500 £600
Gross Weekly Pay for Full Time Workers in the Scottish Borders Residence Based vs Workplace Based, ONS
Proportion of children in low- income families = ( a) Children living in families in receipt of out-of- work benefits + b) Children living in families in receipt of tax credits with income below 60%
c) Total number of children in the area
% Children in Low Income Families - Scottish Borders, 12.3%
% Children in Low Income Families
0.0% 5.0% 10.0% 15.0% 20.0% 25.0% 30.0% 35.0% 40.0% 45.0%
Hawick - Burnfoot - North Gala - Langlee - West Gala - Langlee - Central Eyemouth - Central Hawick - Burnfoot - Central Selkirk - Bannerfield Kelso S - Pinnaclehill Selkirk - Heatherlie Gala - Langlee - East Newtown St Boswells - South Jedburgh - Abbey Kelso S - Bowmont and Edenside Peebles North - Dalatho Eyemouth - Gunsgreen Hawick North - Commercial Road Galashiels - W - Balmoral Rd Jedburgh - East Central Selkirk - Shawburn Coldstream - South Hawick North - Silverbuthall Duns - West Hawick Central - Wellogate Tweedbank - North Coldstream - East Kelso N - High Croft Orchard Park Kelso S - Abbey Greenlaw Earlston - East Reston and Coldingham Moor Area Eyemouth - South Ayton Denholm Hawick West End - Crumhaugh Jedburgh - West Central Walkerburn Birgham and Ladykirk Area Tweedbank - East Tweedbank - West St Boswells - East St Abbs and Eyemouth Landward Innerleithen - North Cockburnspath and Area Coldstream - West Selkirk - Dunsdale Preston and Manderston Area Roxburgh Heiton Eckford Area Newcastleton Melrose - High Street Blainslie and Legerwood Ancrum and Lanton Area Bowden and Lindean Area Duns - East Minto Cauldmill and Boonraw Area Gordon and Hume Area Galashiels - N - Windyknowe Peebles - S - Calvalry Park Lauder - North Hawick West End - Crumhaughill and Parkdaill Selkirk - Hillside Terrace Innerleithen - South Oxnam and Camptown Area Gattonside - Darnick - Chiefswood Innerleithen - West Heriot - Fountainhall - Stow Landward West Linton - Upper Swinton Leithholm and Fogo Area Duns - South Peebles - N - Cuddyside West Linton - Lower Clovenfords and Area Hawick Central - Millers Knowes Galashiels - S - Glenfield
% Children in Low Income Families (August 2013) for the Datazones of the Scottish Borders compared to the Scottish Borders and Scotland
Subject / Skill Reading Writing Listening and Talking Numeracy
Stage Scottish Borders
Scotland
Scottish Borders
Scotland
Scottish Borders
Scotland
Scottish Borders
Scotland
P1 - Early Level 86%
81%
82%
78%
87%
85%
86%
84%
P4 – First Level 81%
75%
75%
69%
86%
81%
77%
73%
P7 - Second Level 79%
72%
74%
65%
83%
77%
74%
68%
S3 - Third Level or better 97%
86%
96%
84%
97%
87%
94%
86%
S3 - Fourth Level 69%
39%
63%
37%
71%
41%
68%
49%
2005/06 2006/07 2007/08 2008/09 2009/10 2010/11 2011/12 2012/13 2013/14 2014/15 Scottish Borders 88.0% 90.3% 87.0% 87.4% 88.3% 92.3% 90.9% 92.0% 94.2% 95.3% Scotland 85.0% 87.0% 86.5% 85.7% 86.8% 88.9% 89.9% 91.4% 92.3% 92.9% 78.0% 80.0% 82.0% 84.0% 86.0% 88.0% 90.0% 92.0% 94.0% 96.0% 98.0%
Proportion of School Leavers at an Initial Positive Destination, SDS
2001 2003 2005 2007 2009 2011 Scottish Borders 75.4 75.3 76.6 77.3 77.8 78.7 Scotland 73.3 73.8 74.6 75.1 75.9 76.6 70 72 74 76 78 80
Male Life Expectancy, NRS
2001 2003 2005 2007 2009 2011 Scottish Borders 80.3 79.9 80.6 81.0 81.6 82.0 Scotland 78.8 79.0 79.5 79.9 80.4 80.8 76.0 78.0 80.0 82.0 84.0
Female Life Expectancy, NRS
74.7 75.6 75.8 75.8 77.0 77.3 77.3 77.4 77.4 77.5 77.6 77.7 78.3 78.5 78.5 78.6 78.7 78.8 79.6 79.7 80.4 80.4 80.5 80.6 81.2 81.8 82.0 82.5 83.6 Scottish Borders , 78.1 Scotland, 76.6 70.0 72.0 74.0 76.0 78.0 80.0 82.0 84.0 86.0 Galashiels West Langlee Galashiels South Galashiels North St Boswells and Newtown area Hawick West End Burnfoot and area Selkirk Kelso South Hawick North Peebles North Newcastleton and Teviot area Eyemouth Hawick Central Duns Coldstream and area Jedburgh Cheviot East Melrose and Tweedbank area Earlston, Lauder and Stow area Berwickshire East West Linton and Broughton area Kelso North Peebles South Innerleithen and Walkerburn area Berwickshire West Cheviot West Ettrick, Yarrow and Yair Berwickshire CentralMale Life Expectancy (5 year average 2009-2013), NRS
79.1 79.5 79.9 80.0 80.6 80.9 81.1 81.4 81.4 81.5 81.7 82.2 82.3 82.3 82.4 82.5 82.7 82.9 83.3 83.5 84.1 84.2 84.5 85.0 85.3 85.5 85.8 87.5 89.5 Scottish Borders, 82.0 Scotland, 80.8 72.0 74.0 76.0 78.0 80.0 82.0 84.0 86.0 88.0 90.0 92.0 Galashiels North Selkirk Burnfoot and area Langlee Galashiels West Peebles North Hawick West End St Boswells and Newtown area Hawick Central Eyemouth Coldstream and area Cheviot West Earlston, Lauder and Stow area Galashiels South Cheviot East Duns Jedburgh Hawick North Melrose and Tweedbank area Innerleithen and Walkerburn area Newcastleton and Teviot area West Linton and Broughton area Peebles South Kelso South Berwickshire East Berwickshire West Kelso North Berwickshire Central Ettrick, Yarrow and YairFemale Life Expectancy (5 year average 2009-2013), NRS
2009 2010 2011 2012 2013 2014 2015 Borders - Type Other 5 26 33 45 49 63 77 Borders - Type 2 4,530 4,728 4,846 5,160 5,349 5,565 5,726 Borders - Type 1 596 601 614 626 633 656 664 Borders - Crude Prevalence 4.6% 4.8% 4.9% 5.2% 5.3% 5.5% 5.7% Scotland - Curde Prevalence 4.4% 4.6% 4.7% 4.9% 5.1% 5.2% 5.3% 0.0% 1.0% 2.0% 3.0% 4.0% 5.0% 6.0% 1,000 2,000 3,000 4,000 5,000 6,000 7,000
Number on Diabetes Register by Type for the Borders 2009 to 2015 and Crude Prevalence Rates for Borders and Scotland
Source: Scottish Diabetes Survey
45 46 47 48 49 50 51 52 53 Ayrshire & Arran Borders Dumfries & Galloway Fife Forth Valley Grampian Greater Glasgow & Clyde Highland Lanarkshire Lothian Orkney Shetland Tayside Western Isles Scotland WEMWBS mean score
WEMWBS mean scores by NHS Board All adults, 2012-2014 combined, SHeS Berwickshire Cheviot Eildon Teviot Tweeddale Scottish Borders Yes 7.9% 5.1% 5.5% 8.4% 3.5% 6.1% 0.0% 2.0% 4.0% 6.0% 8.0% 10.0%
Proportion of people feel lonely or isolated as a result of living in a rural area
Source: SBHS 2015
rating their neighbourhood as a Very Good/ Fairly Good place to live.
higher that the level for Scotland
town by a common riding or civic festival.
1999- 2000 2001- 2002 2003- 2004 2005- 2006 2007- 2008 2009- 2010 2012 2013 2014 2015 Scottish Borders 95% 97% 95% 95% 95% 97% 97% 96% 98% 95% Scotland 91% 92% 92% 92% 92% 94% 94% 94% 94% 95% 86% 88% 90% 92% 94% 96% 98% 100%
Proportion of People Who Rate Their Neighbourhood as Very/Fairly Good: Scottish Borders vs. Scotland, SHS
and anti-social behaviour and a low number of fire casualties compared to Scotland.
traffic accident in the Scottish Borders compared to the Scottish average.
100 200 300 400 500 600 700 800 900 1000 2000 3000 4000 5000 6000 2006-07 2007-08 2008-09 2009-10 2010-11 2011-12 2012-13 2013-14 2014-15 2015-16 Recorded Crime Rate per 10,000 Number of Recorded Crimes
Police Recorded Recorded Crimes and rate per 10,000 Population, Police Scotland
Scottish Borders - Recorded Crimes Scottish Borders - Rate Scotland - Rate
2011 and 2014 (Scotland decrease 5.6%)
result with 77.4% of respondents being ‘Very Satisfied/ Fairly Satisfied’ with the kerbside waste and recycling collection.
2011 2012 2013 2014 Scottish Borders (Tonnes) 53,822 52,861 51,242 49,952 Scottish Borders (kg/person) 473 465 450 438 Scotland (kg/person) 492 471 453 460 400 420 440 460 480 500 48,000 50,000 52,000 54,000 56,000 Tonnes of Household Waste
Tonnes of Household General Waste Generated and kg per person, SEPA
2003-2004 2005-2006 2007-2008 2009-2010 2012 2013 2014 2015 Scottish Borders 45 48 58 63 71 82 77 79 Scotland 44 51 60 67 76 78 80 80 10 20 30 40 50 60 70 80 90
Proportion of households with home internet access by year, SHS
Growing the economy of the Borders, and supporting retailers and businesses Providing high quality care for older people Tackling poverty and inequality Raising education attainment and achievement and helping people of all ages obtain the skills they need for learning, life and work Providing activities and facilities for younger people Providing sustainable transport links including demand responsive transport Making more affordable housing available Improving mobile phone coverage in the Borders Improving access to superfast broadband in the Borders Reinstateme nt of Borders railway link to Hawick and Carlisle Increase energy efficiency at work and in the home Providing arts, culture and heritage activities for all ages Teviot 75.3% 45.9% 46.4% 37.3% 40.3% 37.6% 21.2% 29.6% 26.8% 42.9% 13.3% 10.3% Scottish Borders 70.5% 53.0% 47.3% 45.8% 39.6% 37.8% 31.0% 29.7% 29.0% 24.2% 20.0% 16.6% 0.0% 10.0% 20.0% 30.0% 40.0% 50.0% 60.0% 70.0% 80.0%
Proportion of people who rank these issues in the TOP 5 priorities for the Scottish Borders
Source: SBHS 2015
The Scottish Household Survey (SHS) asks various statements about local authority services. The graph below shows the 2015 results for the Scottish Borders and Scotland. Over 50% of the Scottish Borders respondents agreed with the following statements:
10 20 30 40 50 60 70 Good at communicating services High quality services Good at communicating performance Services designed for needs Does its best with the money Addressing key issues Good at listening I can influence decisions I want greater involvement in decisions Percent Agreeing
Percentage agreeing with various statements about local authority services and performance, SHS 2015
Scottish Borders Scotland