
SLIDE 1
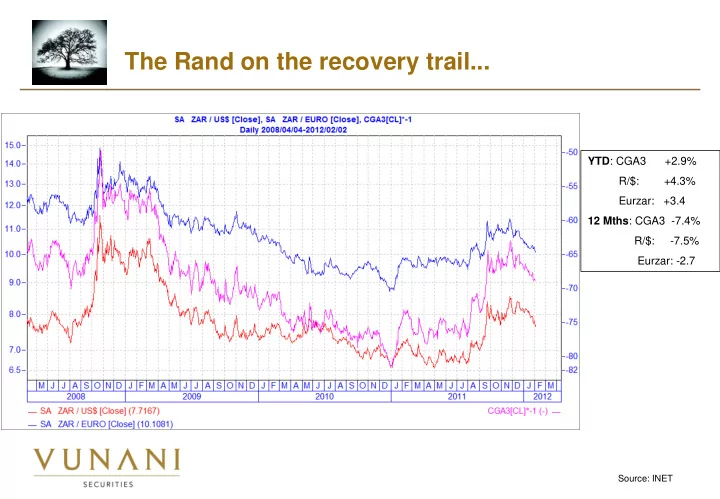
The Rand on the recovery trail...
YTD: CGA3 +2.9% R/$: +4.3% Eurzar: +3.4 12 Mths: CGA3 -7.4% R/$: -7.5% Eurzar: -2.7
Source: INET
The Rand on the recovery trail... YTD : CGA3 +2.9% R/$: - - PowerPoint PPT Presentation
The Rand on the recovery trail... YTD : CGA3 +2.9% R/$: +4.3% Eurzar: +3.4 12 Mths : CGA3 -7.4% R/$: -7.5% Eurzar: -2.7 Source: INET Inflation: near a cyclical peak. Sources: SARB, STATSSA & Vunani Securities
YTD: CGA3 +2.9% R/$: +4.3% Eurzar: +3.4 12 Mths: CGA3 -7.4% R/$: -7.5% Eurzar: -2.7
Source: INET
Sources: SARB, STATSSA & Vunani Securities calculations
Source: INET & Vunani calculations and forecasts
Source: National Treasury & Vunani calculations and forecasts
Summary table of national revenue, expenditure and borrowing for the month ended 31 December 2011
2011/12 2011/2012 Best Case 2011/2012 Worse Case Revised Year to date Based on previous Deviation Proportional: Deviation R thousand estimate year proportional Months Revenue 718 542 150 526 826 838 748 003 022 29 460 872 702 435 785 (16 106 365) Expenditure 888 018 255 648 091 344 868 743 804 (19 274 451) 864 121 792 (23 896 463) Budget deficit(-)/surplus(+) (169 476 105) (121 264 506) (127 353 677) 42 122 428 (161 686 007) 7 790 098 Extraordinary receipts 3 380 000 3 796 489 3 380 000 3 380 000
(520 000) (492 895) (520 000) (520 000)
(166 616 105) (117 960 912) (124 493 677) 42 122 428 (158 826 007) 7 790 098 Financing of the net borrowing requirement Domestic short-term loans (net) 22 000 000 33 661 979 29 738 702 7 738 702 44 882 639 22 882 639 Domestic long-term loans (net) 135 067 000 101 034 430 135 029 789
134 712 573
Foreign loans (net) (2 363 000) (2 479 876) 3 782 285 6 145 285 (3 306 501) (943 501) Change in cash and other balances (- increase) 11 912 105 (14 255 621) (44 057 099) (55 969 204) (17 462 703) (29 374 808) Total financing (net) 166 616 105 117 960 912 124 493 677 (42 122 428) 158 826 007 (7 790 098)
Sources: INET & Vunani calculations and forecasts
Rolling twelve months equity performance Base case Spot Rolling twelve months ending:
Rolling 2 yr
31-Jan-12 30-Jan-13 31-Jan-14
average/year
FTSE/JSE Alsi Index 33792 39173 43862 Exit PER (X) 13.42 13.7 13.3 EPS 2518.51 2853.5 3303.4 EPS growth (%) 34.78 13.3 15.8 Growth in FTSE/JSE Alsi index (%) 15.9 12.0
13.95
Bull case Rolling twelve months ending: 31-Jan-12 30-Jan-13 31-Jan-14 FTSE/JSE Alsi Index 33792.48 45967 51727 Exit PER (X) 13.42 16.1 15.7 EPS 2518.51 2853.5 3303.4 EPS growth (%) 13.3 15.8 Growth in FTSE/JSE Alsi index (%) 36.0 12.5
24.28
Bear case Rolling twelve months ending: 31-Jan-12 30-Jan-13 31-Jan-14 FTSE/JSE Alsi Index 33792.48 32379 35997 Exit PER (X) 13.42 11.3 10.9 EPS 2518.51 2853.5 3303.4 EPS growth (%) 13.3 15.8 Growth in FTSE/JSE Alsi index (%)
11.2
3.50
Sources: INET & Vunani calculations and forecasts
Cash Higher risk appetite justifies reduction in high cash holding. Bonds Upped from underweight to neutral. Domestic inflation cycle, international interest rate prospects and potential prescribed assets positive for bonds Quoted Property Improved prospects justifies going overweight Equities Our preferred asset class… Offshore Equity Added support of Rand weakness largely out, but still cheap. Nevertheless, we'd rather bet on domestic equity instead… Offshore Bonds In spite of global sovereign debt concerns its lack of correllation with domestic equities justifies a fairly high holding - slightly underweight.. Offshore Cash Not worth while… SA Resources Superior prospects above industrials, but potential earnings disappointment suggests one probably shouldn't have too aggressive an overweight allocation. SA Financials Good prospects from oversold levels… SA Industrials Demanding PER; recommend underweight SA Med/Small Companies Time to start nibbling… Not-my-base case Prime rate adjustment either way before the end of 2012…
Source: INET
Source: INET & Vunani calculations and forecasts
1 2 3 4 5 6 7 8 9 10 11 12 Jan-71 Jan-73 Jan-75 Jan-77 Jan-79 Jan-81 Jan-83 Jan-85 Jan-87 Jan-89 Jan-91 Jan-93 Jan-95 Jan-97 Jan-99 Jan-01 Jan-03 Jan-05 Jan-07 Jan-09 Jan-11 R/$ 1 2 3 4 5 6 7 8 9 10 11 12 R/$ PPP Rand (Base: 1970) Actual/Base case (R/$) F
Source: SARB & Vunani Securities
2 4 6 8 10
2 4 6 8 10
Jul-99 Oct-99 Jan-00 Apr-00 Jul-00 Oct-00 Jan-01 Apr-01 Jul-01 Oct-01 Jan-02 Apr-02 Jul-02 Oct-02 Jan-03 Apr-03 Jul-03 Oct-03 Jan-04 Apr-04 Jul-04 Oct-04 Jan-05 Apr-05 Jul-05 Oct-05 Jan-06 Apr-06 Jul-06 Oct-06 Jan-07 Apr-07 Jul-07 Oct-07 Jan-08 Apr-08 Jul-08 Oct-08 Jan-09 Apr-09 Jul-09 Oct-09 Jan-10 Apr-10 Jul-10 Oct-10 Jan-11 Apr-11 Jul-11
Sovereign risk premium (based on 10y US nominal yield) Currency risk premium Country risk premium
% %
Source: SARB & Vunani Securities
2 4 6 8 2 4 6 8 Jul-99 Oct-99 Jan-00 Apr-00 Jul-00 Oct-00 Jan-01 Apr-01 Jul-01 Oct-01 Jan-02 Apr-02 Jul-02 Oct-02 Jan-03 Apr-03 Jul-03 Oct-03 Jan-04 Apr-04 Jul-04 Oct-04 Jan-05 Apr-05 Jul-05 Oct-05 Jan-06 Apr-06 Jul-06 Oct-06 Jan-07 Apr-07 Jul-07 Oct-07 Jan-08 Apr-08 Jul-08 Oct-08 Jan-09 Apr-09 Jul-09 Oct-09 Jan-10 Apr-10 Jul-10 Oct-10 Jan-11 Apr-11 Jul-11
Sovereign risk premium (based on 10y US nominal yield) Sovereign risk premium (based on 5y US nominal yield)
% %
Source: Vunani Securities
0.8 1.8 2.8 3.8 4.8 5.8
0.8 1.8 2.8 3.8 4.8 5.8 Mar-90 Dec-90 Sep-91 Jun-92 Mar-93 Dec-93 Sep-94 Jun-95 Mar-96 Dec-96 Sep-97 Jun-98 Mar-99 Dec-99 Sep-00 Jun-01 Mar-02 Dec-02 Sep-03 Jun-04 Mar-05 Dec-05 Sep-06 Jun-07 Mar-08 Dec-08 Sep-09 Jun-10 Mar-11 Dec-11 Sep-12 Jun-13 % %
Output gap Trend GDP Actual GDP
F
Source: Statssa & Vunani Securities
Source: NPC National Development Plan, 11 November 2011
Source: NPC National Development Plan, 11 November 2011
Source: NPC National Development Plan, 11 November 2011
Source: NPC National Development Plan, 11 November 2011
Source: NPC National Development Plan, 11 November 2011
Source: IMF Global Financial Stability Review, September 2011
Source: IMF Global Financial Stability Review, September 2011
Source: INET
Source: SARB & Vunani Securities
200 400 600 800 1000 1200 1400 1600 200 400 600 800 1000 1200 1400 1600 Jan-98 May-98 Sep-98 Jan-99 May-99 Sep-99 Jan-00 May-00 Sep-00 Jan-01 May-01 Sep-01 Jan-02 May-02 Sep-02 Jan-03 May-03 Sep-03 Jan-04 May-04 Sep-04 Jan-05 May-05 Sep-05 Jan-06 May-06 Sep-06 Jan-07 May-07 Sep-07 Jan-08 May-08 Sep-08 Jan-09 May-09 Sep-09 Jan-10 May-10 Sep-10 Jan-11 May-11
JPMorgan EMBI+ South African 20y yankee bond spread
Spread above US bonds (points) Spread above US bonds (points)
Source: SARB Quarterly Bulletin, March 2011
Source: IMF.
Source: IMF World Economic Outlook, September 2011
Source: IMF Global Financial Stability Review, Sept. ‘11
Source: Business Report, 26 July 2011
GROSS GOVERNMENT DEBT At the end of fiscal year, in trillions of dollars
President Year Government debt Debt limit Actual Debt
George 2001
Estimated debt
2002
Debt limit
2003
$14 294bn
2004
$14 345 $15 476
2005
Debt limit reached
2006
2007 2008 Barack 2009 Obama 2010 2011 BIGGEST CREDITORS: TOP HOLDERS OF US TREASURY BONDS As of end May, in billions of dollars: China Japan Britain
1159.8 912.4 346.5
5.77 5.95 6.20 6.40 6.76 7.38 7.35 8.18 7.91 8.45 8.97 8.95 9.82 9.99 10.62/11.32 11.88 12.1/12.39 13.53 14.29 15.48
Source: US Debt Clock.Org
Source: US Debt Clock.Org
Source: Budget Review, 2011
Sources: INET & Vunani calculations and forecasts
OIL & GAS Spot Rolling twelve months ending:
Rolling 2 yr
30-Nov-11 29-Nov-12 30-Nov-13
average/year
Index 29447 31629 31920 Exit PER (X) 11.50 10.4 10.3 EPS 2560.60 3041.2 3099.0 EPS growth (%) 27.11 18.8 1.9 Growth in Oil & Gas index (%) 7.4 0.9
4.16
MINING Spot Rolling twelve months ending:
Rolling 2 yr
30-Nov-11 29-Nov-12 30-Nov-13
average/year
Index 35155 41599 45269 Exit PER (X) 10.22 10.4 10.3 EPS 3439.63 3999.9 4395.1 EPS growth (%) 86.71 16.3 9.9 Growth in Mining index (%) 18.3 8.8
13.58
FINANCIALS Spot Rolling twelve months ending:
Rolling 2 yr
30-Nov-11 29-Nov-12 30-Nov-13
average/year
Index 21873 26928 31776 Exit PER (X) 11.21 12.0 12.0 EPS 1951.34 2244.0 2648.0 EPS growth (%) 18.94 15.0 18.0 Growth in Financial index (%) 23.1 18.0
20.56
INDUSTRIALS Spot Rolling twelve months ending:
Rolling 2 yr
30-Nov-11 29-Nov-12 30-Nov-13
average/year
Index 34944 36029 43570 Exit PER (X) 17.96 16.1 16.5 EPS 1945.93 2237.8 2640.6 EPS growth (%) 9.43 15.0 18.0 Growth in Industrials index (%) 3.1 20.9
12.02
RESOURCES 16.8 7.8
12.26
FINDI 9.2 19.9
14.56
Source: IMF World Economic Outlook, September 2011
Source: IMF World Economic Outlook, September 2011
Source: IIMF Regional Economic Outlook, Oct. ‘11
Source: IIMF Regional Economic Outlook, Oct. ‘11
Source: Moody’s investors services, 9th November 2011
Source: Moody’s investors services, 9th November 2011
Source: Moody’s investors services, 9th November 2011
Source: NPC National Development Plan, 11 November 2011
Source: NPC National Development Plan, 11 November 2011
Johan Rossouw
(021) 401-1049 johan@vunanisecurities.co.za
E C O N O M I C R E S E A R C H
Source: IMF, World Economic Outlook, April 2011
Source: Budget Review, 2011
Johan Rossouw
(021) 401-1049 johan@vunanisecurities.co.za
E C O N O M I C R E S E A R C H
Source: SARB MPC Statement, 11th November 2011