
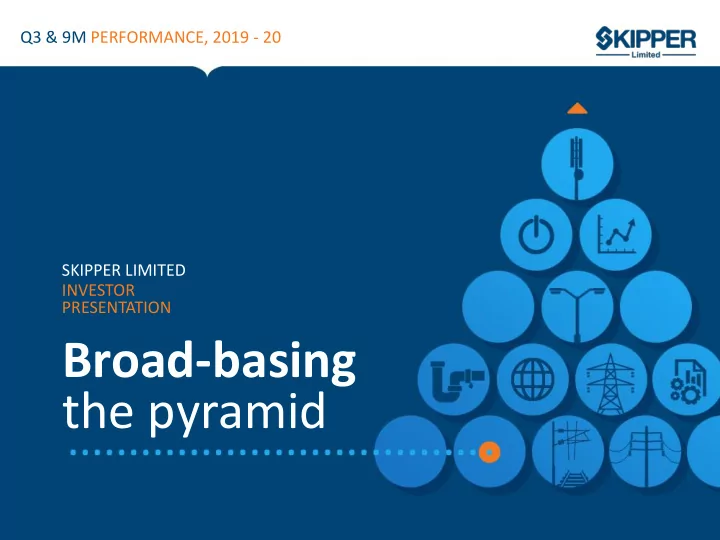
SLIDE 1
SKIPPER LIMITED INVESTOR PRESENTATION
Broad-basing the pyramid
Q3 & 9M PERFORMANCE, 2019 - 20
the pyramid SKIPPER LIMITED INVESTOR PRESENTATION About Us W H O - - PowerPoint PPT Presentation
Q3 & 9M PERFORMANCE, 2019 - 20 SKIPPER LIMITED INVESTOR PRESENTATION Broad-basing the pyramid SKIPPER LIMITED INVESTOR PRESENTATION About Us W H O W E A R E Skipper Limited is Indias largest and world's most competitive
SKIPPER LIMITED INVESTOR PRESENTATION
Q3 & 9M PERFORMANCE, 2019 - 20
SKIPPER LIMITED INVESTOR PRESENTATION
W H O W E A R E
3
4
the S.K. Bansal Group (incorporated 1981).
accessories and fastener manufacture coupled with EPC line construction
and fastest growing polymer pipes & fittings companies
Corporation of India- approved transmission tower and pole manufacturing plants (combined engineering capacity 300,000 MTPA)
effective knowledge pools in the sector comprising 2,450+ members
player; awarded Largest Tower Supplier Award by Power Grid for 3rd consecutive year
in Water Resources sector by Central Board
K E Y FA C T S
S K I P P E R : O N E - S TO P S O LU T I O N P R OV I D E R
M I S S I O N
Engineering products
Capacity: 300,000 MTPA
Highlights Positioned as one of the world's leading transmission tower manufacturer; largest in India Revenues (FY’19) Rs16,452mn
Polymer products
Capacity: 51,000 MTPA
Highlights
India to implement TOC in its
Infrastructure projects
by HDD Highlights
Revenues (FY’19) Rs1,598mn Revenues (FY’19) Rs 658mn
P R O D U C T O F F E R I N G S
G LO B A L P R E S E N C E
SOUTH AMERICA Peru, Colombia, Chile, Paraguay, Panama EUROPE UK, Germany, Spain AFRICA Kenya, Egypt, Ghana, Nigeria, Zambia, Sierra Leone Guinea, South Africa, Botswana, Burundi, Angola MIDDLE EAST Jordan, Saudi Arabia, UAE SOUTH AND SOUTH EAST ASIA Nepal, Bangladesh, Sri Lanka, Indonesia, Philippines, Malaysia AUSTRALIA
F O O T P R I N T S
SKIPPER LIMITED Performance Update
8
Stan d Alon e - F in an c ial Perfo rman c e Q 3 & 9 M F Y ’2 0
Sl Profit & Loss Summary
Q3 FY’20
Q3 FY’19
9M FY’20
9M FY’19 1 Revenues
2,998.4
4,348.2 9,516.6 14,374.8 2 Operating EBITDA (without Forex)
330.1
270.7 1,080.0 1,313.7 % of Revenue 11.0% 6.2% 11.3% 9.1% 3 Forex Gain / (Loss)
17.1
151.3 39.3 (54.0) 4 Reported EBITDA (2+3)
347.2
422.0 1,119.3 1,259.7 % of Revenue
11.6%
9.7% 11.8% 8.8% 5 Depreciation
95.8
85.3 284.2 297.0 6 Interest Expenses
201.3
235.0 649.0 765.5 7 Other Income
12.3
3.5 16.7 10.1 8 Profit Before Tax (4-5-6+7)
62.3
105.2 202.7 207.3 9 Tax
17.8
40.6 61.7 72.8 10 Profit After Tax (8-9)
44.6
64.6 141.0 134.5
Rs in Mn
B U S I N E S S R E P O R T C A R D
9
R e a s o n s i m p a c t i n g R e v e n u e
Q3 & 9M FY’20 Revenue impacted on account of –
Very limited Size contracts in domestic market has come up for offering in the past 2 years. Consciously slowed down supplies to the customer unwilling to give secured payment terms Considering the liquidity situation in the market, Limited our credit risk exposure across our customers ; at this stage we find it more prudent to not chase growth in revenue at the cost of financial discipline. Lack of short term orders in market Structural changes undergoing implementation in Polymer Segment
Management ideology of not chasing growth at the cost of financial discipline will be maintained and adhered.
Stand Alone operating EBITDA margins improved to 11.0% for the quarter and 11.3% for nine Months period in spite of lower sales; The margins of engineering business are back to their normal historical range of 13%. Polymer TOC implementation Progressing well; Improvement continues on both Revenue & Margin front Stable raw material prices and corrective steps undertaken to reduce overhead and fixed costs leaded to improved margin performance ; Stronger expected execution in our Engineering & Polymer business going forth will further boost its performance. Productivity and cost reduction initiatives at the plant and site level are expected to further improve efficiency in operations and aid to stable margins Actively pursuing projects worth Rs 3,500 crore on international front and about Rs 700 Crores
10
P E F R O R M A C E H I G H L I G H T S
Performance Highlights Performance Update Key Update
Company’s In-House R&D unit has been recognised by Department of Scientific and Industrial Research (DSIR, GOI), allowing the company to avail certain expenditure (including Capital expenditure other than Land & Building) as exemption under Income Tax Act Skipper became first Company in India to have successfully designed, fabricated and type tested a 765 KV S/C Monopole
Engg 82% Polymer 10% Infra 8%
11
S e g m e n t P e r fo r m a n c e Q 3 & 9 M F Y ’ 2 0
S E G M E N T R E P O R T Revenue Mix – 9M FY’20
Note: Segment EBITDA is net of Forex and includes allocation of un-allocable expenditure in pro-rata share of sales in their respective segment
Segment Financial Summary Q3 FY’20 Q3 FY’19 9M FY’20 9M FY’19 Engg. Products Net revenue 2,284.6 3,839.4 7,860.5 12,656.3 EBIDTA (w/o forex) 295.5 267.7 1,020.6 1,272.2 % of Revenue 12.9% 7.0% 13.0% 10.0% Polymer products Net revenue 384.0 331.0 925.0 1,250.8 EBIDTA (w/o forex) 15.0 3.3 28.0 15.7 % of Revenue 3.9% 1.0% 3.0% 1.3% Infra projects Net revenue 329.8 177.9 731.0 467.6 EBIDTA (w/o forex) 19.6 (0.3) 31.3 25.8 % of Revenue 5.9%
4.3% 5.5% Total Net revenue 2,998.4 4,348.2 9,516.6 14,374.8 EBIDTA (w/o forex) 330.1 270.7 1,080.0 1,313.7 % of Revenue 11.0% 6.2% 11.3% 9.1%
12
I M P R O V E M E N T T R E N D S
desired range for past 4 consecutive quarters.
cost, Stable Raw material prices and better operational efficiencies resulted in such improvement.
forth.
Note: Engineering EBITDA is net of Forex and includes allocation of un-allocable expenditure in pro-rata share of its sales
11.8% 11.0% 7.0% 13.3% 12.9% 13.1% 12.9% 10.6% 10.2% 6.2% 12.2% 11.6% 11.4% 11.5% 0.0% 5.0% 10.0% 15.0% 20.0% Q1'19 Q2'19 Q3'19 Q4'19 Q1 Fy'20 Q2 Fy'20 Q3 Fy'20 Engineering Stand Alone
13
E n g i n e e r i n g P r o d u c t s – O r d e r B o o k C o m p o s i t i o n – D e c 2 0 1 9
O R D E R B O O K P I E 65% 11% 24%
Domestic T&D Domestic - Telecom & Railways Exports
Total Order Book Rs 2,280 Crores
46% 27% 27%
PGCIL SEB & Private Export
T&D Order Book Rs 2,022 Crores
14
O R D E R I N F L O W S & C O M P O S I T I O N 9M FY’20 Order Inflow Total – 1,126 Crores
Strong Bidding Pipeline of 4,150 Crores as on 31st Dec 2019;
International – 3,450 Cr & Domestic - 700 Cr
62% 33% 5%
T&D Domestic T&D - Export Railways & Telecom
Railways and for supplies across various export markets; Share of export inflow rose to 66% in Q3 FY’20
The company expects Ordering & Execution to gain pace in the coming quarters with increased participation opportunities from Power Grid, SEB, TBCB projects, Exports and Infrastructure push in North East & East India. Growing global competiveness; Focusing on international markets to drive the ordering growth Large bunching up of order that remained postponed + Rs 50,000 Crores of GEC related projects to come up for bidding from next year will provide much needed boost to the domestic transmission industry Strong order traction from Domestic Railway
15
R i s i n g E x p o r t S h a r e
300 373 100 200 300 400
12M FY'19 9M FY'20
Export Order Inflow (Rs in Crores)
16
E x p o r t - P o s i t i o n e d f o r G r o w t h International Certifications Credential Establishments Audit Approval of Plant Registration with International EPC players
FY’19 FY’20 & 21 Time to ripe the benefits
players
3,450 crores are at the highest level in company history is a true testimony of
exports order book to 50% in next 2 years from 13 % last year
17
PERFORMANCE OUT LOOK
Rebound expected in domestic T&D action both on Ordering and Execution front from next quarter onwards Focus on strengthening the international T&D
50% of revenue in next 2 years Desired EBITDA margin focus of 12-13% in FY’20 Implementation of TOC in both Engineering and Polymer business to significantly improve its working capital cycle and bottom-line profitability Volume-value play to drive shareholder value
B U S I N E S S O U T L O O K
18
T HE B I G MESSAGE
Profitability in a downturn is a validation of Skipper’s business model Conscious slowing down: Not chase growth at the cost of financial discipline Sectoral consolidation to lead to next rebound;
switch sectors based on margin positive Skipper
ready through re- navigated business model Progressive broadbasing to strengthen revenues and margins –
quality of business
B U S I N E S S M A N T R A
BROADBASING OUR PYRAMIDS
20
E N G I N E E R I N G P R O D U C T S B U S I N E S S
Broadbasing the pyramid
Broadbasing the number of sectors addressed
Riding the growth of some fast- growing segments into the long-term like telecom and railways
Broadbasing the customer mix within each sector (government and non-government)
Riding the inflection point within India where the power transmission sector opened to private players
Broadbasing the number of customers
Addressing the needs of a reasonable number of the large and a large number of small fast growing companies
Broadbasing the countries
Entering new geographies to derisk from an excessive dependence on one or few economies
W H AT I S B R O A D B A S I N G T H E P Y R A M I D ?
21
To strengthen margins; some sectors promise lower working capital cycle To be able to capitalise on sectoral upturns with speed; faster off the blocks To strengthen competitiveness; last person standing To transform from an Indian company into a global player To report a lower sectoral beta; smooth the performance curves To progress towards any- market business sustainability
W H Y W E A R E B R O A D B A S I N G
W H Y B R O A D B A S I N G T H E P Y R A M I D ?
22
W H AT W I L L FA C I L I TAT E O U R B R O A D B A S I N G
Deep knowledge capital on product manufacture, quality standards and certifications Fungible manufacturing capacity (from one product to another with no capex); only integrated manufacturer in the sector Existing presence in 30+ countries; relationships with 100+ global EPC players Progressively enhanced capacity utilisation, revenues and amortisaton economies Global quality certifications and customer approvals in place – a ready foundation waiting to be scaled Ability to enter segments with low capital cost (strengthening competitiveness from day one) Low long-term debt on the books Strategic location; proximity to raw material sources; freight competitive
S T I M U L U S B E H I N D B R O A D B A S I N G T H E P Y R A M I D ?
23
T H E I M PA C T O F T H E B R OA D B A S I N G : F O U R D R I V E R S
Focus on projects coming out
private transmission players (Domestic T&D) Building credential and relationship with global EPC players to gain presence in international market Focus on telecom and railways sectors (domestic sectoral diversification) Increased bidding for projects promising superior IRR
Order book break-up as per segments T&D order book break-up as per End user
K E Y D R I V E R S O F T H E I D E A
87% 7% 6% T&D Telecom Railways
Order book break-up as per segments
46% 27% 27%
PGCIL SEB & Others Exports
As on Dec, FY20 As on Dec, FY20
24
B R OA D B A S I N G W OV E N A R O U N D F I N A N C I A L D I S C I P L I N E
Driven by the philosophy of profitable growth Bids for projects that meet basic IRR criteria Believes that no business is better than bad business Consistent resistance to chasing volumes over profits Can temporarily and selectively sacrifice margins for a larger strategic market entry and growth Geographic diversification (global) dictated by large volumes, superior realisations and quicker receivables Invested in pre-bid team capabilities; attractive strike rate
SKIPPER LIMITED INVESTOR PRESENTATION
26
BROADBASING TO REDUCE DOMESTIC DEPENDENCE
international organizations for confidence- enhancing certifications
Global EPC player ; Enlisted 11 prominent customers in two years
from South Korea, Uruguay, Paraguay, Romania, Croatia, Mexico, Panama, Poland, Afghanistan, Russia, Australia and Nicaragua among others
exports to 40 % of revenues in next two year and to 50% in three years (15% today)
and capacity shut downs in China is making Indian players like us globally competitive
global exhibitions in two years to enhance visibility
Country CFE/LAPEM Mexico CWB Canada & USA DEWA Dubai ROHAS Malaysia CE CERTIFICATION Europe ACHILLES/STATNET Nordics Saudi Electric Company Saudi Arabia The Jordanian Electric Power Company Ltd Jordan RETIE Colombia EETC Egypt BPC Bhutan KETRACO Kenya TCN Nigeria NGCP Philippines
International certifications
E X P L O R I N G N E W G E O G R A P H I E S
(holding major market share) with low cost reliable Transmission Tower supplies (Towers are almost 50% of the value of any project).
contractors, helping them leverage their relations with the Utilities better
DEWA (Middle east), Achilles (Nordic countries) and Sirim (South East Asia) which gives it better access to T&D business in these regions. Continuously increasing , Utility approval list with more key utilities in the European markets
27
L E A D E R S H I P P O S I T I O N
S K I P P E R I S C L E A R LY P O I S E D TO B E I N T H E W I N N I N G S P OT I N T H E I N T E R N AT I O N A L T & D S E C TO R
WHAT MAKES US MORE COMPETITIVE
Higher Price : Chinese manufacturers are almost 10-15% higher priced than Indian manufacturers, owing to un favorable currency and much higher labor costs. Limited Capacities to offer : Chinese manufacturers have cut capacities owing to pollution issues and the remaining capacity is tied up in their Belt – Road project so are quoting very long lead times. Reliability: More and more global utilities are interested to source from Indian manufacturers compared to Chinese due to regular quality issues over the years.
28
G R O W I N G G L O B A L C O M P E T I T I V E N E S S
29
Bidding Volumes T&D sector Mar 2018 Rs in Cr Dec-19 Rs in Cr Change % International T&D 810 3,450 326% Domestic T&D 1,625 700
Total 2,435 4,150 70%
Considerable increase in Bidding Volumes from International T&D Sector
G R O W I N G G L O B A L C O M P E T I T I V E N E S S 67% 33%
Mar 2018
Domestic T&D International T&D These developments reinforce our belief of a significant turnaround in the international markets. 17% 83%
Dec-2019
Domestic T&D International T&D
30
GLOBAL T&D INVESTMENT OPPORTUNITIES
G L O B A L N E E D
According to World Energy Outlook (WEO) 2015, a total of US$ 8.4 trillion investments are expected to flow in the global T&D investments between 2015 and 2040, averaging US$320 billion per year.
31
T&D INDUSTRY OVERVIEW IN INDIA
evacuation capacity
amounting to 345 GW as on September 2019 which is estimated to grow at a CAGR of 6.5% between 2018 and 2023.
create one consolidated market
transmission network to grow
I N D I A S T O R Y
32
STRONG OPPRTUNITY IN INDIA’S T&D SECTOR
Rs 1.3 lakh crore allocated for intra-state transmission capacity. SEBs and private players to drive orders
Electricity for All by 2019 to drive sectoral rebound
Renewable power sources)
to reduce AT&T losses to 15%
(Sterlite, Essel and Adani) creating multiple revenue engines
Total line capacity 11th Plan: 2,57,481 CKM 12th Plan: 3,64,921 CKM 13th Plan: 4,70,515 CKM
D O M E S T I C O P P O R T U N I T I E S
33 E X P E C T E D T R A N S M I S S I O N S Y S T E M A D D I T I O N D U R I N G 2 0 1 7 - 2 2 Transmission line length(ckt. km) As of March 2017 Addition during 2017-18 (till September 2017) Planned addition during 2017-22 Balance capacity to be added by 2022
HVDC (800/500 kV) 15,556
4,280 765 kV 31,240 2,046 27,300 25,254 400 kV 1,57,787 8,678 46,000 37,322 220 kV 1,63,268 1,627 28,000 26,173 Total 3,67,851 12,551 1,05,580 93,029 HDVC capacity (MW) +/-800 kV 5,000 3,000 14,000 11,000 +/-500 kV 13,500
19,500
11,000 Substation capacity (MVA) 765 kV 1,67,500 10,000 1,14,000 1,04,000 400 kV 2,40,807 20,445 1,03,000 82,555 220 kV 3,12,958 8,620 75,000 66,380 Total 7,21,265 39,065 2,92,000 2,52,935
Source : Central Electricity Authority
34
REASONS FOR LONG-TERM SECTORAL OPTIMISM
quadruple and emerge as a $ 10 trn economy in the next 15 years
growing economy in the next decade
considerably lower than peer countries which is estimated to reach 3000 units by 2040 compared to 1150 units in 2018.
increase in demand in a growing economy; under-penetration likely to correct (supply likely to increase demand)/ substantial growth of renewable energy P O S I T I V E O U T L O O K
35
Railways
Around 6,000 km of electrification planned annually for the next three-four years
expected soon
(across T&D, Railways and Telecom).
Telecom
Accelerating data boom: 5G rollout expected to drive next stage of tower rollout
preferred tower supplier for Jio and all major domestic telecom companies
design/support in process and quality assurance
E M E R G I N G G R O W T H D R I V E R S
R A I LWAY S & T E L E C O M
G A M E P O I N T
36
Received CORE approval for all the plant to manufacture and supply various types of Railway overhead wiring support structures.
Projected spending of Rs 35,000 cr over a period of next 3-4 lined up for Railway Electrification in India ; 40-45% of this to get invested in Rail Structures Large and robust growth plan in the pipeline: multi-year growth outlook Proposed electrification of 6,000 km network in 2018-19 and 7,000 km route in 2019 -20 Projects of Rs 40,000 cr-plus to connect capitals of five NE states and border areas with rest of the country and areas bordering China, Myanmar and Bangladesh with the rest of the country. Being an East India player we are logistically well placed to target these large upcoming
RAILWAYS ELECTRIFICATION
4000 8000
2016-17 2017-18 2018-19 2019-20 2020-21
Railway up-gradation (Rs in Cr) R A I LWAY E L E C T R I F I C AT I O N S E C T O R
37
S K I P P E R I S C L E A R LY P O I S E D TO B E I N T H E W I N N I N G S P OT I N T H E R A I LWAY S E C TO R
L E A D E R S H I P P O S I T I O N
38
TELECOM TOWER
growth
five years
headroom
Internet of things and M2M among others are driving the need for more towers China India
1.4 bn
Customers
1.18 bn
Customers
1.94 mn
Telecom tower
0.46 mn
Telecom towers
I N D I A O N T H E C U S P O F M O B I L E D A T A E X P L O S I O N India;s smartphone users will more than double by 2022 (in mn) The number of connected devices will boom in india (in bn) Average mobile data consumption per month in India (in gigabytes) 2017 2022 900 600 300 2017 2022 2.4 1.6 0.8 2017 2022 18 12 6 2.0 1.2 0.4
T E L E C O M S E C T O R
39
S K I P P E R I S C L E A R LY S E T TO B E I N T H E W I N N I N G S P OT I N T H E T E L E C O M S E C TO R
L E A D E R S H I P P O S I T I O N
40
SKIPPER’S POLYMER BUSINESS
Polymer manufacturing capacity of 51,000 MTPA Plants invested state-of-the-art manufacturing technology 70%+ gross block less than six years
Among few Indian companies assured
manufacture One of few Indian companies with NSF certification
Quality certifications
P O LY M E R P R O D U C T S S E G M E N T
41
PARTNERSHIP WITH VECTOR CONSULTING
Skipper Pipes partnered Vector Consulting Group VCG a leading management consulting firm in India Partnership to increase retail market share and transform supply chain Directed to gain decisive competitive advantage
Objectives
To increase market share To build a robust sales organization with strong distribution ‘Pull’-based product replenishment system; high retail availability; lower corporate inventory. Processes directed to establish stronger ties with channel partners Developing partnerships with trade influencers through a long-term loyalty program
S T R AT E G I C PA R T N E R S H I P
42
OUR USP
profitability
at billing points
reduction of inventory days
Skipper is the only Indian polymer pipe company to implement Theory of Constraints (TOC) approach in an organized manner Directed to empower the supply chain processes and systems
T H E O R Y O F C O N S T R A I N T S
43
AWARDS AND ACCOLADES
A W A R D : T H E L A R G E S T T O W E R S U P P L I E R F O R 3 r d C O N S E C U T I V E Y E A R G I V E N B Y : P O W E R G R I D C O R P O R A T I O N O F I N D I A L T D . ( P G C I L ) A W A R D : E M E R G I N G P O W E R E P C P L A Y E R G I V E N B Y : E P C W O R L D A W A R D : G L O B A L H R E X C E L L E N C E G I V E N B Y : W O R L D H R D C O N G R E S S A W A R D : N O . 1 E M E R G I N G B R A N D I N P O L Y M E R P I P E S & F I T T I N G S G I V E N B Y : W C R C A W A R D : M O S T V A L U A B L E C O N T R I B U T I O N T O P O W E R I N D U S T R Y G I V E N B Y : E T E D G E A W A R D : S T A R P E R F O R M E R A W A R D F O R T H E Y E A R 2 0 1 5 - 1 6 G I V E N B Y : E E P C I N D I A A W A R D : T H E B E S T P O L Y M E R B R A N D G I V E N B Y : C O N S T R I C T I O N T I M E S A W A R D : M O S T E T H I C A L C O M P A N Y G I V E N B Y : W O R L D C S R D A Y
H O N O R S
44 D I S C L A I M E R
For any queries please contact: Aditya Dujari (Investor Relations) Skipper Limited 3A, Loudon Street, 1St Floor, Kolkata 700 017 E-Mail: aditya.dujari@skipperlimited.com Tel: + 91 33 2289 2327/5731 Mobile: 9830806906
This Investor Presentation has been prepared by Skipper Limited for investors, solely for informational
their own evaluation of the Company and does not purport to be all-inclusive or to contain all of the information a prospective or existing investor may desire. In all cases, interested parties should conduct their own investigation and analysis of the Company and the data set forth in this information. Skipper makes no representation or warranty as to the accuracy or completeness of this information and shall not have any liability for any representations (expressed or implied) regarding information contained in, or for any omissions from, this information or any other written or oral communications transmitted to the recipient in the course of its evaluation of the Company. This Information includes certain statements and estimates provided by the Company with respect to the projected future performance of the Company. Such statements, estimates and projections reflect various assumptions by management concerning possible anticipated results, which assumptions may or may not be correct. No representations are made as to the accuracy of such statements, estimates or projections. Prospective investors will be expected to have conducted their own due diligence investigation regarding these and all other matters pertinent to investment in the Company. This presentation may contain statements that are not historical facts, referred to as “forward looking statements.” The corporation’s actual future results may differ materially from those suggested by such statements, depending on various factors including statements contained in the Company's filings with the Stock Exchanges and our reports to shareholders. The Company does not undertake to update any written or oral forward-looking statements that may be made from time to time by or on behalf of the Company