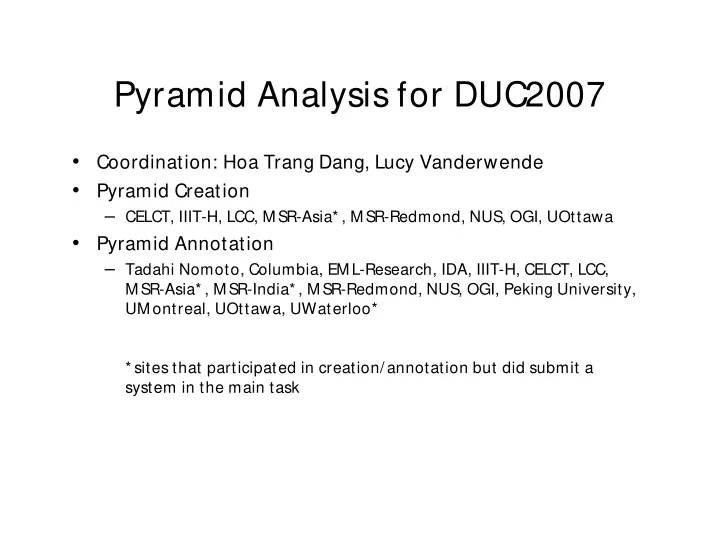

Pyramid Analysis for DUC2007 • Coordination: Hoa Trang Dang, Lucy Vanderwende • Pyramid Creation – CELCT, IIIT-H, LCC, M SR-Asia* , M SR-Redmond, NUS, OGI, UOttawa • Pyramid Annotation – Tadahi Nomoto, Columbia, EM L-Research, IDA, IIIT-H, CELCT, LCC, M SR-Asia* , M SR-India* , M SR-Redmond, NUS, OGI, Peking University, UM ontreal, UOttawa, UWaterloo* * sites that participated in creation/ annotation but did submit a system in the main task
Pyramid Analysis for DUC2007 • Coordination of both: Hoa Trang Dang, Lucy Vanderwende • Pyramid Creation – Cameron Fordyce, Prasad Pingali, Rahul K, Andy Hickl, Finley Lacatusu, Like Liu, Yuanjie Liu, and Li Shi, CY Lin, Ben Gelbart (BHG), Lin Ziheng, Qui Long, Seeger Fisher, M argaret M itchell, Stan Szpakowicz, Anna Kazantseva, Alistair Kennedy, Darren Kipp • Pyramid Annotation – Tadahi Nomoto, Barry Schiffman, Sergey Sigelman, M ichael Strube, Katja Filippova, Vivi Nastase, John Conroy, Prasad Pingali, Rahul K, Cameron Fordyce, Andy Hickl, Finley Lacatusu, Like Liu, Yuanjie Liu, and Li Shi, CY Lin, Jagadeesh Jagarlamudi, A. Kumaran, Ben Gelbart (BHG), Lin Ziheng, Qui Long, Seeger Fisher, M argaret M itchell, Sujian (plus others), Guy Lapalme, Fabrizio Gotti, Alistair Kennedy, Darren Kipp, Anna Kazantseva, Terry Copeck, M aheedhar Kolla
2007 Pyramid Creation • 8 groups created and checked 23 pyramids (each 2-3 pyramids, approx 4-6 hours per pyramid) – For each cluster: first site created the pyramid second site commented on the pyramid first site made revisions and sent pyramid to Hoa • Different from previous years: – Only one pyramid was created per cluster and commented on vs. two separate pyramids needing to be reconciled – No final vetting vs. final vetting provided by Columbia
2007 Pyramid Annotation • 15 groups annotated peer summaries (each 1-2 sets, approx 7 hours per set) – For each cluster: first site annotated 13 peer summaries (2 baselines and 11 system summaries) second site commented on the annotations first site made revisions and sent annotations to Hoa • Different from previous years: – Only one annotation for peer summaries and commented on vs. two annotations needing to be reconciled* – No final vetting vs. final vetting provided by Columbia * as in previous years, no changes to the original pyramid were allowed once annotation begins; several sites would like to add the ability to make comments as they annotate
Why continue? • This is a community-based effort, and the effort the community put in demonstrates that there is considerable interest in the pyramid method of analysis. – we now have pyramids for approx. 75 clusters (more if you also count the clusters in M SE) • The results of the pyramid analysis and some further analysis were presented this morning in Hoa’s overview talk • Pyramids provide diagnostics to understand what’s present and more importantly, what’s missing in system summaries. – Data for the next few slides can be made available (like Lapalme’s spreadsheet) if others are also interested; further suggestions are welcome (e.g. average # of SCUs identified by systems) – The following data and charts were created by Jagadeesh Jagarlamudi – thanks Jags!
SCU’s in 2006 vs. 2007
Distribution of SCUs (score 4)
Distribution of SCUs (score 3)
Distribution of SCUs (4 & 3)
Correlation between 4-scoring SCUs & ROUGE-2 Cluster (Sorted based on # of 4 SCUs) ROUGE-2 D0739 0.07722265 D0718 0.09275871 D0729 0.09537576 D0714 0.10423394 D0740 0.09643379 D0704 0.07820909 D0710 0.11747636 D0711 0.09910076 D0701 0.10038394 D0716 0.13642992 D0721 0.10365008 D0728 0.08133568 D0730 0.13932538 D0706 0.0872997 D0724 0.06270258 D0720 0.12433742 D0727 0.09194538 D0734 0.08470894 D0742 0.12981674 D0703 0.11153697 D0743 0.05748174 D0705 0.10409409
Correlation between 4,3-scoring SCUs & ROUGE-2 4& 3 identified ROUGE-2 cluster 20 0.09537576 D0729 16 0.13642992 D0716 15 0.08470894 D0734 13 0.09275871 D0718 13 0.07820909 D0704 12 0.09643379 D0740 11 0.07722265 D0739 11 0.11153697 D0703 11 0.10423394 D0714 11 0.10365008 D0721 10 0.11747636 D0710 10 0.08133568 D0728 10 0.06270258 D0724 10 0.13932538 D0730 9 0.12433742 D0720 8 0.10038394 D0701 8 0.12981674 D0742 8 0.09194538 D0727 7 0.09910076 D0711 7 0.0872997 D0706 6 0.11732227 D0707 5 0.05748174 D0743
Correlation between 4,3-scoring SCUs & ROUGE-2 4 & 3 (Ident) ROUGE-2 Column1 4 & 3 (Total) Fraction 20 0.09537576 23 0.869565 16 0.13642992 19 0.842105 15 0.08470894 16 0.9375 13 0.09275871 17 0.764706 13 0.07820909 14 0.928571 12 0.09643379 17 0.705882 11 0.07722265 27 0.407407 11 0.11153697 15 0.733333 11 0.10423394 12 0.916667 11 0.10365008 12 0.916667 10 0.11747636 15 0.666667 10 0.08133568 14 0.714286 10 0.06270258 13 0.769231 10 0.13932538 12 0.833333 9 0.12433742 13 0.692308 8 0.10038394 11 0.727273 8 0.12981674 10 0.8 8 0.09194538 8 1 7 0.09910076 10 0.7 7 0.0872997 10 0.7 6 0.11732227 7 0.857143 5 0.05748174 6 0.833333
Recommend
More recommend