
SLIDE 1
1
Results you can rely on
Wisconsin Manufacturers & Commerce: Federal Air Regulations Update
Gale F. Hoffnagle, CCM, QEP Air Quality Consulting Practice Leader TRC Companies, Inc.
Results you can rely on
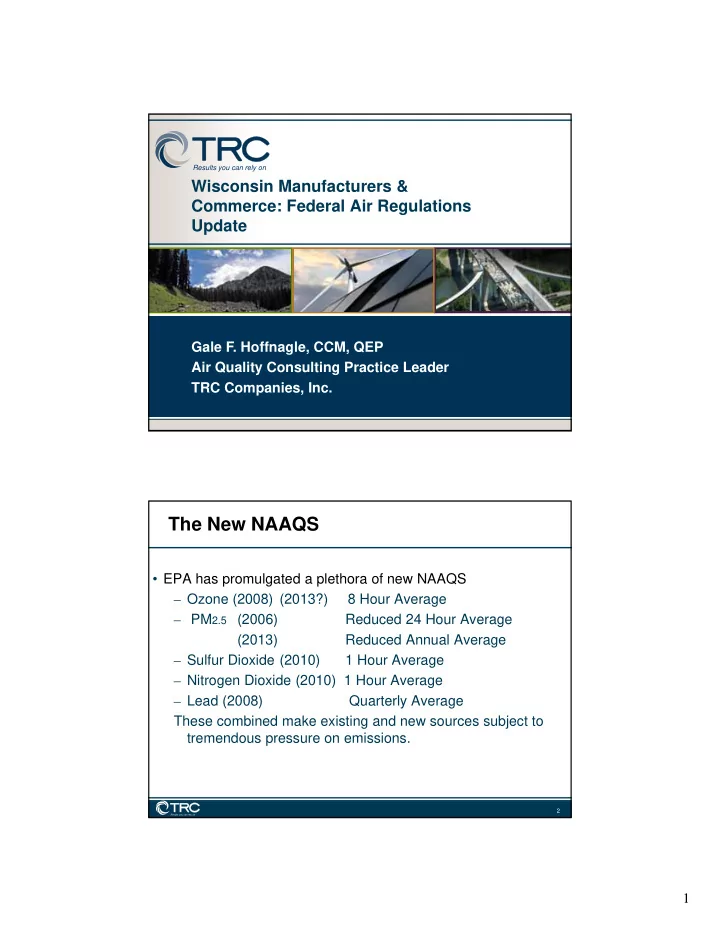
The New NAAQS
- EPA has promulgated a plethora of new NAAQS
– Ozone (2008) (2013?) 8 Hour Average – PM2.5 (2006) Reduced 24 Hour Average (2013) Reduced Annual Average – Sulfur Dioxide (2010) 1 Hour Average – Nitrogen Dioxide (2010) 1 Hour Average – Lead (2008) Quarterly Average These combined make existing and new sources subject to tremendous pressure on emissions.
2