The lifetime prevalence of depression in is approximately 1 - - PDF document

the lifetime prevalence of depression in
SMART_READER_LITE
LIVE PREVIEW

The lifetime prevalence of depression in is approximately 1 - - PDF document

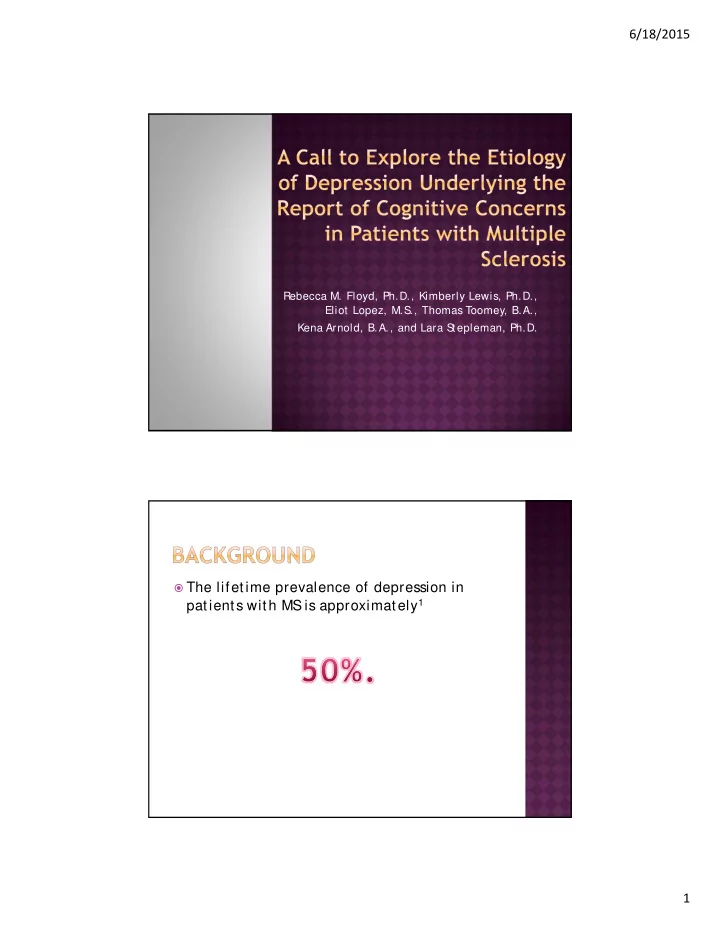
6/18/2015 Rebecca M. Floyd, Ph.D., Kimberly Lewis, Ph.D., Eliot Lopez, M.S ., Thomas Toomey, B.A., Kena Arnold, B.A., and Lara S tepleman, Ph.D. The lifetime prevalence of depression in is approximately 1 patients with MS 1 6/18/2015


slide-1
SLIDE 1

6/18/2015 1

Rebecca M. Floyd, Ph.D., Kimberly Lewis, Ph.D., Eliot Lopez, M.S ., Thomas Toomey, B.A., Kena Arnold, B.A., and Lara S tepleman, Ph.D.  The lifetime prevalence of depression in

patients with MS is approximately1

slide-2
SLIDE 2

6/18/2015 2

 Cognitive impairments seen in patients with

depression:

 Learning2  Verbal memory2

 Recall but not recognition3

 Visual memory2  Verbal fluency4,5  Executive set-shifting4,6,7  Motor speed8  S

patial working memory5

 Cognitive symptoms commonly seen in

patients with multiple sclerosis (MS )

 Complex attention (e.g., multi-tasking) 9  Information processing speed9  Learning and memory9  Perceptual skills9  Executive functions (e.g., problem solving,

initiation, organization, planning) 9

 Word finding9

slide-3
SLIDE 3

6/18/2015 3

 Reasons for considering etiology of cognitive symptoms:  Untreated depression in MS

patients has been shown to worsen, rather than resolve, over time10,11

 Factors such as poorer psychological functioning and cognitive

functioning have played greater roles in MS patients leaving employment than physical disability9

 Depression, as prevalent as it is known to be in MS

, is often under-diagnosed11

 Cognitive profiles may overlap between depression and MS

, but cognitive symptoms related to depression may be more modifiable10  S

  • me cognitive tasks are more heavily impacted by different

features of depression (severity, symptom type, etc.)10

 S

ummary:

 Thus, it may not only be helpful to treatment to

know if cognitive symptoms are occurring in the context of depression versus MS .

 It may also be worthwhile to treatment to know

what symptoms of depression may be most impacting cognitive functioning.

slide-4
SLIDE 4

6/18/2015 4 This study presents an initial attempt to examine whether anhedonia or low mood, two symptoms that are routinely screened for in identifying patients who might be experiencing depression, are more strongly associated with report of cognitive concerns.

 Both anhedonia and low (depressed) mood

are considered the gateway symptoms into depression12

 Although they often correlate, assessing for

both enhances sensitivity for detection of maj or depressive disorder and may differentially relate to treatment

  • utcomes13,14,15
slide-5
SLIDE 5

6/18/2015 5

 Presence of anhedonia may signify a more

severe depression, greater resistance to depression treatment, and be associated with greater cognitive impairment and involvement of particular neuroanatomical structures10,13

 Participants  54.8%

Caucasian;

 44.0%

African American;

 79.2%

female

 Age: 46.67 years (mean), 12.03 (S

D), 20-81 (range)

 20-41 years (youngest third of the sample)  52-81 years (oldest third of the sample)

slide-6
SLIDE 6

6/18/2015 6

 Procedures and Materials  Health/ Medical Psychology residents (interns) and

fellows provide screening and consultation services to patients attending medical appointments within the MS Clinic

 Patients are screened using the PHQ-2, PC-PTS

D, a 2- item Conj oint S creener for S ubstance Abuse, and a problem checklist

 The PHQ-214 has two items, one querying about

anhedonia and the other about mood

 Response choices for each item are ‘ not at all’ (0),

‘ several days’ (1), ‘ more than half the days’ (2), ‘ nearly every day’ (3)

 Problems include cognitive/ memory, among 17 other

problem areas (e.g., adj usting to diagnosis, medication management, relationship stress, etc.)

slide-7
SLIDE 7

6/18/2015 7

Anhedonia Low Mood

Y es (50% )1 No (50% )1 Y es (58.1% )16 No (41.9% )16 Y es (50% ) 1 No (50% ) 1 Ethnicity Caucasian 37.3%

b

62.7%

b

37.3%

b

62.7%

b

43.3% 56.7% African American 31.6%

b

68.4%

b

31.6%

b

68.4%

b

44.2% 55.8% Gender Female 35.6%

b

64.4%

b

35.6%

b

64.4%

b

45.6% 54.4% Male 32.1%

b

67.9%

b

32.1%

b

67.9%

b

36.5% 63.5% Age Group Oldest Third 35.6%

b

64.4%

b

35.6%

b

64.4%

b

33.3%

b,c

66.7%

b

Y

  • ungest Third

37.9%

a

62.1%

a

37.9%

b

62.1%

b

51.7%

c

48.3%

Note: a: p < .05, b: p < .01 for endorsement; c: p < .05, d: p < .01 for demographic

Cognitive Concerns Expecting 65% to Endorse17 Expecting 43% to Endorse17 Y es (65% ) No (35% ) Y es (43% ) No (57% ) Ethnicity Caucasian 14.1%

b

85.9%

b

14.1%

b

85.9%

b

African American 14.9%

b

85.1%

b

14.9%

b

85.1%

b

Gender Female 14.6%

b

85.4%

b

14.6%

b

85.4%

b

Male 13.2%

b

86.8%

b

13.2%

b

86.8%

b

Age Group Oldest Third 12.6%

b

87.4%

b

12.6%

b

87.4%

b

Y

  • ungest Third

17.2%

b

82.8%

b

17.2%

b

82.8%

b

Note: a: p < .05, b: p < .01 for endorsement; c: p < .05, d: p < .01 for demographic

slide-8
SLIDE 8

6/18/2015 8

Predictor R2 χ2 Df B Wald OR OR 95% CI

Anhedonia 0.069 10.099** 2

  • 0.158

0.131 0.854 0.362— 2.013 Low Mood 1.242 7.530** 3.462 1.426— 8.405

Full S ample: N = 259

not e: CI = confidence interval. OR = odds ratio. R2 = Nagelkerke R2. *p < .05. **p < .01

Predictor R2 χ2 Df B Wald OR OR 95% CI

Anhedonia 0.104 8.449* 2

  • 0.815

1.663 0.443 0.128— 1.528 Low Mood 1.839 7.711** 6.290 1.718— 23.035

Caucasian S ample: n = 142

not e: CI = confidence interval. OR = odds ratio. R2 = Nagelkerke R2. *p < .05. **p < .01

slide-9
SLIDE 9

6/18/2015 9

Predictor R2 χ2 Df B Wald OR OR 95% CI

Anhedonia 0.059 3.904 2 0.438 0.517 1.550 0.469— 5.115 Low Mood 0.784 1.599 2.190 0.650— 7.383

African American S ample: n = 114

not e: CI = confidence interval. OR = odds ratio. R2 = Nagelkerke R2. *p < .05. **p < .01

Predictor R2 χ2 Df B Wald OR OR 95% CI

Anhedonia 0.079 9.306* 2

  • 0.420

0.761 0.657 0.256— 1.688 Low Mood 1.433 8.099** 4.190 1.562— 11.237

Female S ample: n = 205

not e: CI = confidence interval. OR = odds ratio. R2 = Nagelkerke R2. *p < .05. **p < .01

slide-10
SLIDE 10

6/18/2015 10

Predictor R2 χ2 Df B Wald OR OR 95% CI

Anhedonia 0.086 2.154 2 1.111 1.059 3.037 0.366— 25.194 Low Mood 0.295 0.074 1.343 0.161— 11.169

Male S ample: n = 53

not e: CI = confidence interval. OR = odds ratio. R2 = Nagelkerke R2. *p < .05. **p < .01

Predictor R2 χ2 Df B Wald OR OR 95% CI

Anhedonia 0.053 2.433 2

  • 0.091

0.011 0.913 0.172— 4.854 Low Mood 1.080 1.633 2.944 0.562— 15.422

Oldest Third of the S ample: n = 87

not e: CI = confidence interval. OR = odds ratio. R2 = Nagelkerke R2. *p < .05. **p < .01

slide-11
SLIDE 11

6/18/2015 11

Predictor R2 χ2 Df B Wald OR OR 95% CI

Anhedonia 0.069 3.698 2

  • 0.294

0.183 0.745 0.194— 2.867 Low Mood 1.295 3.026 3.652 0.849— 15.716

Y

  • ungest Third of the S

ample: n = 87

not e: CI = confidence interval. OR = odds ratio. R2 = Nagelkerke R2. *p < .05. **p < .01

 Only low mood was an unique predictor of

cognitive complaints.

 In general, people endorsing low mood were

3.5 times more to have cognitive concerns identified during screening than those who denied experiencing low mood in the past two weeks.

slide-12
SLIDE 12

6/18/2015 12

 The odds of cognitive complaints being identified

varied a bit across subsamples from the overall figure

  • f 3.5

 Caucasians were 6.3 times more likely  Females were 4.2 times as likely  Interestingly, African American patients, male patients,

the oldest patients, and the youngest patients who reported low mood were not significantly more likely to have cognitive concerns identified than those who denied low mood

 In fact for many patients such as these, depression was not a

factor in the report of cognitive symptoms and may have been absent in their clinical presentation

 Limitations  Program evaluation rather than research study  Fatigue and anhedonia confounded  Exploration limited to only two symptoms of

depression

 Very low percentage of patients with cognitive

concerns identified may have reduced power,

 this issue may have been even more pronounced when

dividing the sample into subsets to examine the relationship of depressive symptoms and cognitive concerns in a single demographic category (e.g., males)

slide-13
SLIDE 13

6/18/2015 13

 Possible implications of findings:  Professionals may want to give greater

consideration to interventions directly elevating mood, in the treatment of depression when cognition is also of concern, than to behavioral activation and stimulation.

 Although anhedonia was not significantly related

to cognitive concerns in this limited exploration, teasing apart anhedonia from fatigue may be advisable to uncover masked effects of anhedonia versus fatigue

1S

iegert, R. J., & Abernethy, D. A. (2005). Depression in multiple sclerosis: A review. Journal of Neurology, Neurosurgery, & Psychiat ry, 76, 469-475.

2Goodwin, G. M. (1997). Neuropsychological and neuroimaging evidence for the involvement of the

frontal lobes in depression. Journal of Psychopharmacology, 11, 115-122.

3Roy-Byrne, P

. P ., Weingartner, H., Bierer, L. M., et al. (1986) Effortful and automatic cognitive processes in depression. Archives of General Psychiat ry, 43, 265-267.

4Beats, B. C., S

ahakian, B. J., & Levy, R. (1996). Cognitive performance in tests sensitive to frontal lobe dysfunction in the elderly depressed. Psychological Medicine, 26, 591-603.

5Elliott, R., S

ahakian, B. J., McKay, A. P ., et al. (1996). Neuropsychological impairments in unipolar depression: The influence of perceived failure on subsequent performance. Psychological Medicine, 26, 975-989.

6Austin, M.-P

., Mitchell, P ., Wilhelm, K., et al. (1999). Melancholic depression: A pattern of frontal cognitive impairment. Psychological Medicine, 29, 73-85.

7Murphy, F

. C., S ahakian, B. J., Rubinstein, J. S ., et al. (1999). Emotional bias and inhibitory control processes in mania and depression. Psychological Medicine, 29, 1307-1321.

8Purcell, R., Maruff, P

., Kyrios, M., et al. (1997). Neuropsychological function in young patients with unipolar maj or depression. Psychological Medicine, 27, 1277-1285.

9DeLuca, J., & Nocentinide, U. (2011). Neuropsychological, medical and rehabilitative management of

persons with multiple sclerosis. NeuroRehabilit at ion, 29, 197-219.

10Austin, M.-P

., Mitchell, P ., & Goodwin, G. M. (2001). Cognitive deficits in depression: Possible implications for functional neuropathology. Brit ish Journal of Psychiat ry, 178, 200-206.

11Mohr, D. C., & Goodkin, D. E. (1999). Treatment of depression in multiple sclerosis: Review and

meta-analysis. Clinical Psychology: S cience & Pract ice, 6, 1-9.

slide-14
SLIDE 14

6/18/2015 14

12S

heeran, T ., Reilly, C. F ., Raue, P ., Weinberger, M. I., Pomerantz, J., & Bruce, M. L. (2010). The PHQ- 2 on OAS IS

  • C: A new resource for identifying geriatric depression among home health
  • patients. Home Healt hcare Nurse, 28(2), 92-104.

13Gorwood, P

. (2008). Neurobiological mechanisms of anhedonia. Dialogues in Clinical Neuroscience, 10(3), 291-299.

14Kroenke, K., S

pitzer, R. L., & Williams, J. B. (2003). The Patient Health Questionnaire-2: Validity of a two-item depression screener. Medical Care, 41(11), 1284-1292.

15Leventhal, A. M., Piper, M. E., Japuntich, S

. J., Baker, T . B., & Cook, J. W. (2014). Anhedonia, depressed mood, and smoking cessation outcome. Journal of Consult ing and Clinical Psychology, 82(1), 122-129.

16Nagaraj , K., Taly, A. B., Gupta, A., Prasad, C., & Christopher, R. (2013). Prevalence of fatigue in

patients with multiple sclerosis and its effect on the quality of life. Journal of Neurosciences in Rural Pract ice, 4(3), 278-282.

17Denney, D. R., S

worowski, L. A., & Lynch, S . G. (2005). Cognitive impairment in three subtypes of multiple sclerosis. Archives of Clinical Neuropsychology, 20(8), 967-981.