THE INTERSTELLAR MEDIUM OF THE GALACTIC CENTRE REGION David Jones - - PowerPoint PPT Presentation

the interstellar medium of the galactic centre region
SMART_READER_LITE
LIVE PREVIEW

THE INTERSTELLAR MEDIUM OF THE GALACTIC CENTRE REGION David Jones - - PowerPoint PPT Presentation

THE INTERSTELLAR MEDIUM OF THE GALACTIC CENTRE REGION David Jones (Radboud University, Nijmegen, The Netherlands) Workshop on Off-the-Beaten-Track Dark Matter and Astrophysical Probes of Fundamental Physics, Trieste, 13-17 April, 2015.


slide-1
SLIDE 1

THE INTERSTELLAR MEDIUM OF THE GALACTIC CENTRE REGION

David Jones (Radboud University, Nijmegen, The Netherlands)

Workshop on Off-the-Beaten-Track Dark Matter and Astrophysical Probes of Fundamental Physics, Trieste, 13-17 April, 2015.

slide-2
SLIDE 2

INTRODUCTION

  • The workshop will bring together experimental, observational and

theoretical communities, in the fields of astro-particle physics, early universe cosmology and dark matter searches and phenomenology.

  • We will focus on both astrophysical probes or hints of new physics,

as well as ‘non standard’ dark matter signatures.

  • We aim to assess current anomalies, the constraining power of

near future astrophysical or cosmological probes and the status of promising particle physics models.

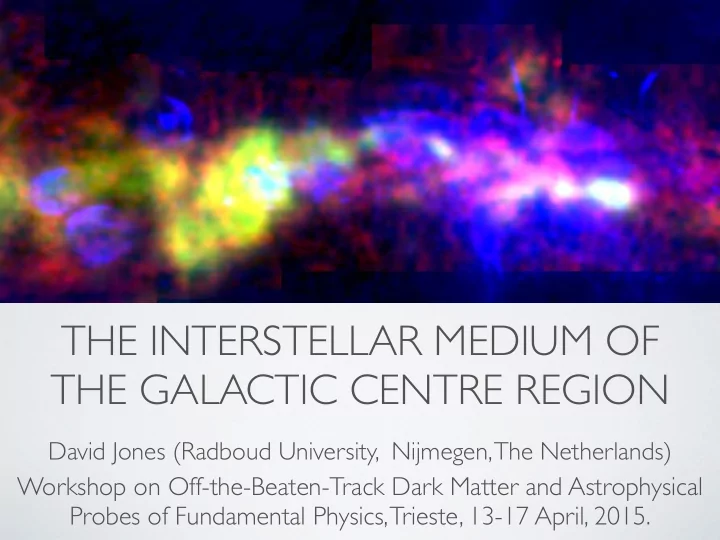
Last page: 3-colour composite; blue = 330 MHz; green = NH3(1,1); red = CO(1—0)

slide-3
SLIDE 3

INTRODUCTION

  • How does the previous slide have to do with the Galactic centre?
  • Galaxies are expected to have “cuspy” dark matter distributions

centred on their dynamical centres, hence the centre of our Galaxy is important as a test of dark matter theory and detection.

  • My task, then as I see it, is to talk about the structure of the Galactic

centre as it purports to dark matter: its cosmic-ray and molecular gas content, in-so-far as our knowledge of its mass composition, distribution and the dynamical processes they instigate are concerned.

slide-4
SLIDE 4

THE GALACTIC CENTRE (GC)

  • Where is it? It’s at the centre of the Galaxy, duh!
  • But seriously, it’s about 8-8.5 kpc from the Sun — making it, by

definition, the closest example of a galactic nucleus (high- resolution) and is the dynamical centre of the Galaxy.

Kruijssen+, MNRAS, 2014

slide-5
SLIDE 5

THE MOLECULAR ENVIRONMENT OF THE GC

  • The Galactic centre contains the central molecular zone (CMZ).
  • This region contains ~10% of all current star formation and the Galaxies’ molecular gas, in about

0.001% of its volume.

  • The gas density is x100 that of the disk.
  • Stellar clusters with 106 M⊙ (c.f. globular clusters, dwarf galaxies).


 Below: 3-colour composite; blue = 330 MHz; green = NH3(1,1); red = CO(1—0)

slide-6
SLIDE 6

WHY ISN’T THE GC MORE ACTIVE?

  • Given that the Galactic centre contains

a SMBH, as well as:

  • A strong magnetic field (>100μG;

Crocker, Jones+, 2010);

  • Massive dust and gas 


reservoirs;

  • A complex radio morphology

implying a large SNR-rate, high 
 CR flux (evidenced by point-
 like & diffuse gamma-ray 
 emission).

  • Why do we not observe the GC to be

brighter and forming stars at a greater rate?

Longmore+, 2013

slide-7
SLIDE 7

SHOCKS, STAR FORMATION & THE GC

  • Many surveys have been done of

molecular lines in the GC

  • Indeed Sgr B2 is home to almost all

known interstellar molecules ever

  • bserved; it is the most massive star-

forming region in the Galaxy.

  • The most recent and systematic of

these have been the 3mm (40”), 7mm (1.3’) and 12mm (2.6’) Mopra+ATCA surveys of the CMZ (Jones+2011, Ott +2014).

  • Different molecules trace different

environments.

  • J. Ott
slide-8
SLIDE 8

PHOTO-DISSOCIATION REGION (PDR) TRACERS

  • J. Ott
slide-9
SLIDE 9

SHOCK TRACERS

  • Typically, SiO traces strong shocks, whilst HNCO is more

easily dissociated by UV radiation

  • J. Ott
slide-10
SLIDE 10

SHOCKS VS PDRS IN THE GC

  • Comparing the CS to HNCO, shows that the GC is

dominated by shocks, and not PDRs

Martin+ 2008

  • J. Ott
slide-11
SLIDE 11

SHOCK TRACERS CORRESPOND WITH TEMPERATURE

  • SiO and HNCO in the CMZ do

not correlate well (top, right).

  • When compared to a

temperature map (obtained using the NH3(1,1) and (2,2) inversion transition (below, right), this can be seen to match with the interaction of the bar with the CMZ (below).

  • Warm temperatures (~60 K)

correspond to strong (SiO) shocks, cold with weak (HNCO & ~30 K).

  • J. Ott
slide-12
SLIDE 12

THE DISTRIBUTION OF MOLECULAR MATERIAL IN THE GC

  • The dynamics of the central regions

suggests that gas is falling onto the CMZ, hence its large mass.

  • But it is thought that the geometry
  • f the region leads to a high rate of

star formation, through cloud-cloud collisions which create the shocked regions seen above.

  • This in turn creates a high SNR rate

(~0.4/century; Crocker, Jones+, 2011), and drives a wind from the GC.

  • J. Ott
slide-13
SLIDE 13

EVIDENCE FOR A GC WIND

  • The well-known far-infrared/radio-

continuum (FIR-RC) correlation suggests that stars — through star formation and death — connect UV and optical photons to ionised particles.

  • If the ionised particles lose all their

energy in-situ (Völk, 1989), then there should also be a radio-FIR-gamma-ray correlation (Thompson+, 2006).

  • However, the GC is not on this

correlation by ~4σ (Crocker, Jones+, 2011).

slide-14
SLIDE 14

EVIDENCE FOR A GC WIND

  • On the basis of the FIR-RC correlation, one would expect (Thompson+, 2006; Crocker, Jones+, 2011) the

gamma-ray emission to scale as:
 
 υLυ (GeV) ~ 2x10

  • 5

(η10 LTIR),


where η10 is the canonical 10% of SNR energy going into CRs.

  • Fermi and HESS data obtain a luminosity of ~3x10

36

and 1x10

35

erg/s, respectively (Crocker, Jones+, 2011).

  • This is only ~10 and 2% of the flux expected on the basis of this relation; about a 4σ deficit.
slide-15
SLIDE 15

EVIDENCE FOR A GC WIND

  • Spectral steepening of electrons is

seen in the GC Lobe (Law, 2010), suggesting synchrotron ageing.

  • As Crocker, Jones+ (2011)

showed, the large-scale (400 pc) radio spectrum (viz. Sυ∝υ-0.54) requires a hard (i.e., F∝E-2.1) electron population.

  • The flat γ-ray spectrum (F∝E-2.2)

also suggests that the particles are being advected out of the region.

Crocker, 2012

slide-16
SLIDE 16

WHERE HAVE ALL THE CRS GONE?

  • The GC can be thought of as a star-burst in miniature (Crocker, 2012; Crocker, Jones+, 2010, 2011):
  • 10% of gas, dust in 0.001% of Galaxies’ volume
  • High SF and SNR rate.
  • High B-field (x100 that of the disk).
  • Yet it falls off the FIR/RC and RC/gamma-ray (and hence FIR/gamma-ray) correlations.
  • Has molecular signatures (i.e., shocks vs PDR chemistry) that are inconsistent with star-bursting galaxies.
  • Implies a large-scale (i.e., ΩGC≳0.5°) wind dominating the radio+gamma-ray flux, whilst the diffused CRs

dominate the small scale (i.e., Jones, 2014).

  • It is this wind that is supplying the energy for the recently-discovered Fermi Bubbles (Su+, 2010) and S-

PASS Lobes (Carretti+, 2013).

slide-17
SLIDE 17

THE FERMI BUBBLES

  • They are enormous, bilateral

“bubbles” of emission extending to 50 degrees from the Galactic plane.

  • Discovered in the data of the Fermi

gamma-ray telescope by Su+ (2010).

  • Robustly detected in the residual 


images from the 1.6-year Fermi 
 data between 1 and 100 GeV.

  • Now even detected in non-

background-subtracted data.

Source: http://article.wn.com/view/2012/02/20/Fermi_telescope_unveils_gammaray_bursts_highest_power_side/

slide-18
SLIDE 18

THE S-PASS LOBES

Carretti, et al, Nature, 2013

slide-19
SLIDE 19

THE S-PASS LOBES

  • The S-PASS Lobes are similar structures seen in the polarised Parkes southern sky survey at 2.3 GHz (Carretti+, 2013).
  • Survey at 2.3 GHz, with 184 MHz bandwidth and 9’ resolution.
  • Seen to ‘envelop’ the Fermi Bubbles and curve to the Galactic west.
  • The spectral index (with 23 GHz WMAP data) spans -1 to -1.2 and steepens with distance from the plane.
  • Polarisation fractions of 25-31%, and inferred B-field values of 6-12 μG.
slide-20
SLIDE 20

BUBBLE-LOBE FORMATION THEORIES

  • The Bubbles are difficult to explain in a consistent manner due to:
  • 1. The large luminosity of ∼4 × 1037 erg s−1 in the gamma-ray domain —

an order of magnitude larger than the Bubbles’ microwave luminosity but more than order of magnitude less than their X-ray luminosity; Su+ (2010)

  • 2. A hard spectrum of dN/dE∼E−2 from 1 to 100 GeV
  • 3. Their vast extent and relatively uniform gamma-ray intensity.
slide-21
SLIDE 21

BUBBLES AS OUTFLOWS FROM SGR A*

  • The Bubbles could be revealed via inverse Compton (IC)

losses of a population of electrons simultaneously producing the GeV and multi-GHz photons.

  • Hypotheses for the acceleration of these electrons have

included:

  • Bubble-pervading shocks (Cheng+, 2011), or distributed,

stochastic, acceleration on plasma wave turbulence (Mertsch & Sarkar, 2011).

  • A prior outburst by an AGN-like outburst from the 


central black hole, Sgr A*, in the past few million 
 years (Su+, 2010).

slide-22
SLIDE 22

BUBBLES FROM HADRONS

  • An explanation that can reconcile the seemingly difficult parts of the Bubbles’ nature are cosmic-ray

protons (strictly CR protons + heavier ions but hereafter simply protons).

  • Here, CR protons, accelerated by supernovae in the Galactic centre region and advected into the

Bubbles on a wind (Crocker & Aharonian, 2011, Crocker, Jones+, 2010, Crocker, Jones+, 2011).

  • The protons (that are not advected) are also observed as the diffuse TeV gamma-ray glow in the 


Galactic centre.

  • This gives a prediction for the connection of the Bubbles: they should connect to the TeV gamma-

ray “glow-points”.

Aharonian+, 2006

slide-23
SLIDE 23

THE BUBBLE-LOBE-GC CONNECTION

  • The use of the H-α emission

from the SHASSA survey shows a correlation with the depolarisation region surrounding the GC.

  • This was used by Carretti+

(2013) to argue that the S-PASS Lobes are a GC phenomenon.

  • If one assumes that they are

related to the Fermi Bubbles, this also places them there.

slide-24
SLIDE 24

THE BUBBLE-LOBE-GC CONNECTION

  • There are reasons to think

that the Bubbles and the Lobes are connected:

  • Similar morphology,

including to the Bubble substructures.

  • Similar energetics: UB~1055

erg, which implies ~1038 erg/s over 1010 years for the proton scenario.

slide-25
SLIDE 25

THE BUBBLE-LOBE-GC CONNECTION

slide-26
SLIDE 26

CONCLUSIONS

❖ The Galactic centre is a complex and dynamic place. ❖ New observations are revealing a complex morphology in

the region that suggests “blotchy” star formation, perhaps due to the geometry of the region.

❖ A wind/outflow seems to be in operation, keeping the star-

formation rate high, but hampering outflows from the central black hole (Sgr A*).

❖ This outflow may be feeding the Fermi Bubbles and S-PASS

Lobes.