
SLIDE 1
The Importance of Financial Inclusion for People with Disabilities
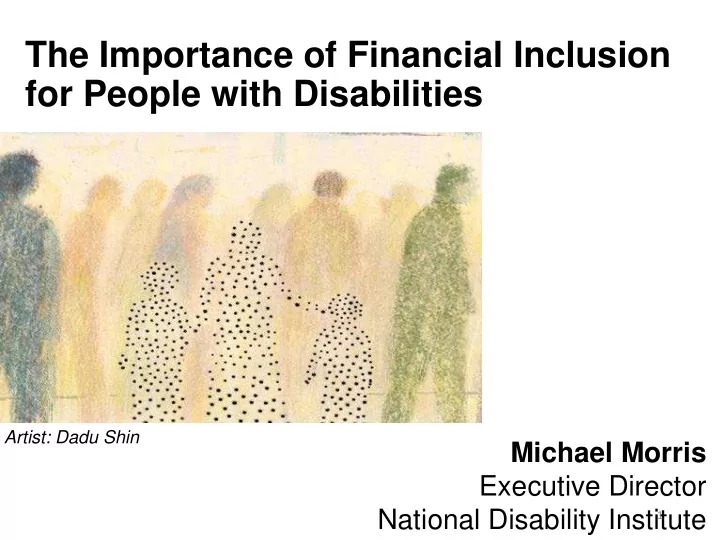
Artist: Dadu Shin
Michael Morris Executive Director National Disability Institute
1
The Importance of Financial Inclusion for People with Disabilities - - PowerPoint PPT Presentation
The Importance of Financial Inclusion for People with Disabilities Artist: Dadu Shin Michael Morris Executive Director National Disability Institute 1 NDI History In 2000, no disability organization or government agency at any level
1
2
3
4
5
6
within a person and that the only way to address that condition is to “fix” the person.
between the person and the environment—that people are limited by barriers in society, not solely by their
physical, programmatic or attitudinal.
environment to meet the needs of ALL.
For a good descript ion of t he S
hakespeare in The Disabilit y S t udies Reader, 2017. ht t ps:/ / books.google.com/ books? hl=en&lr=&id=aiQlDwAAQBAJ&oi=fnd&pg=PA195&dq=t om+shakespeare+social+model&ot s=TAzrb-LDo- &sig=A78t LWkL6FvxX2ZlxeWpkfhBgEc#v=onepage&q=t om% 20shakespeare% 20social% 20model&f=false
7
8
*Karen I. Fredriksen-Goldsen, Hyun-Jun Kim, and Susan E. Barkan (2012) Disability Among Lesbian, Gay, and Bisexual Adults: Disparities in Prevalence and Risk. American Journal of Public
Artist: Corbett O’Toole, Disabled Women of Color (Quilt) 9
25% 39% 32% 22% 28% 10% 22% 20% 12% 13% 0% 5% 10% 15% 20% 25% 30% 35% 40% 45% NH White Black Latino Asian All
Poverty Rate Among Working-age Adults with Disabilities
With Disability No Disability
10
18.9% 18.4% 17.6% 18.1% 7.4% 7.2% 6.5% 5.7%
5.0% 10.0% 15.0% 20.0% 2011 2013 2015 2017
Wit h Disability No Disability
2017: 12.4 percentage point difference 2011: 11.5 percentage point difference
Source: 2011-2017 FDIC Surveys of Unbanked and Underbanked Households
11
39% 18% 4% 1% 57% 80%
Source: 2017 FDIC Surveys of Unbanked and Underbanked Households
12
49 26 40 47 9 23
No Disabilit y With Disability Not at all difficult S
Very difficult
Source: FINRA Investor Education Foundation, National Financial Capability Survey, 2015
13
33% 28% 12% 23% 19% 7%
0% 5% 10% 15% 20% 25% 30% 35% Used Any AFS in Last 12 Mont hs Transaction AFS Credit AFS
Use of Alternative Financial Services In Last 12 Months
With Disability No Disability
Source: 2017 FDIC Surveys of Unbanked and Underbanked Households
14
2 9 12 19 2 6 7 13
Denied bank credit Discouraged about applying for bank credit Used nonbank credit Unmet need for credit (any of previous t hree indicat ors)
Unmet Need for Credit by Disability S tatus, 2017
With Disabilty No Disability
Source: 2017 FDIC Surveys of Unbanked and Underbanked Households
15
47% 40% 24% 15% 10 20 30 40 50 2015 2017
Percentage of Households with No Mainstream Credit Products
Wit h Disabilt y No Disability
35 percentage point disability gap in 2017 23 percentage point disability gap in 2015
Source: 2017 FDIC Surveys of Unbanked and Underbanked Households
16
17
18
19
20
21