The Epoch of Disk Settling: z ~ 1 to Today Susan Kassin (NPP Fellow, - - PowerPoint PPT Presentation

the epoch of disk settling z 1 to today
SMART_READER_LITE
LIVE PREVIEW

The Epoch of Disk Settling: z ~ 1 to Today Susan Kassin (NPP Fellow, - - PowerPoint PPT Presentation

The Epoch of Disk Settling: z ~ 1 to Today Susan Kassin (NPP Fellow, NASA Goddard), Ben Weiner (Steward), Sandra Faber (Lick/UCSC), Jonathan Gardner (NASA Goddard) + DEEP2 Survey members Simulation by Fabio Governato , V=220 km/s, 50 Mpc box,


slide-1
SLIDE 1

The Epoch of Disk Settling: z~1 to Today

Susan Kassin (NPP Fellow, NASA Goddard), Ben Weiner (Steward), Sandra Faber (Lick/UCSC), Jonathan Gardner (NASA Goddard) + DEEP2 Survey members

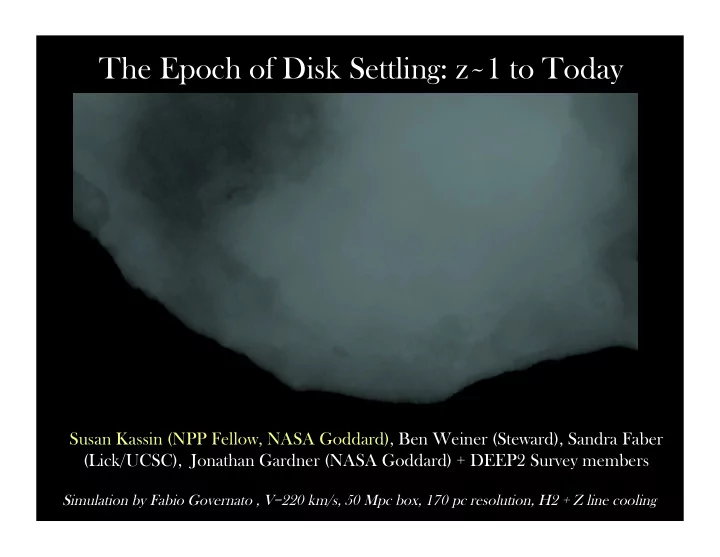
Simulation by Fabio Governato , V=220 km/s, 50 Mpc box, 170 pc resolution, H2 + Z line cooling

slide-2
SLIDE 2

What do these simulations tell us about galaxy formation?

  • Much of the mass and angular momentum of

galaxies may come from cold flows

  • There is more merging/accretion at early times
slide-3
SLIDE 3

At a redshift of about 1…

Blue galaxies are for the most part in place,

  • MB brighter by only ~1 mag compared to today (e.g., Bell+04, Willmer+06, Faber+07)
  • Number density doesn’t change (ditto)
  • Stellar mass unchanging to within uncertainties (e.g., Bundy+06,Borch+06, Pozzetti+10)
  • Sizes are only marginally smaller (factor of 1.4; Dutton+11)

but there are hints that they are different beasts than blue galaxies today.

  • Higher star-formation rates by x10 (e.g., Noeske+07)
  • More disturbed morphologies (e.g., Abraham & van den Berg+01, but see Oesch+10 for

higher mass)

  • Higher molecular gas fractions (Tacconi+10, Daddi+10)
slide-4
SLIDE 4

Sample selection is key!

  • If we select high-z galaxies to be like those

today, we will minimize evolution.

Our final sample is selected essentially on magnitude (RAB < 24.1) and emission line strength.

slide-5
SLIDE 5

DEEP2 Kinematics Sample: Distribution in Color-M*

  • ~10K galaxies in

DEEP2 field 1 (grey)

  • 544-galaxy

sample discussed in this talk (black) follows “blue cloud”

time

SAK+12b

slide-6
SLIDE 6

Velocity Dispersion (σg) Rotation Velocity (Vrot)

Most B Blue G Galaxies T Today P y Play N y Nice ce

Stars a and g gas a are w well-o

  • ordered:
  • rotate i

in x x – – y p y plane

  • move u

up a and d down a a b bit i in z z

slide-7
SLIDE 7

Rotation Velocity (Vrot) Velocity Dispersion (σg) quantifies disordered motions… (…like o

  • ur M

Milky W y Way o y once ce w was)? They r y rotate and show disordered motions

Most B Blue G Galaxies a at z z~1 P Play R y Rough

HST/ACS

slide-8
SLIDE 8

Slit is 1” wide = 8 kpc Slit is 1” wide = 0.02 kpc

z ~ 0.001 z ~ 1.0 Galaxy spectra are

  • bserved with thin slits…

but galaxies are smaller in the past

σg is Different at High Redshift

slide-9
SLIDE 9

At High-z, σg Quantifies the Amount of Disordered Motions

6”

Vrot - dominated

σg - dominated

HST/ACS, z~1

Vrotsini = 208 km/s σg= 40 km/s

Mixed

Vrotsini = 75 km/s σg = 55 km/s Vrotsini = 29 km/s σg = 59 km/s radius

3 Example Galaxies:

Weiner+ 06a,b, Kassin+07, Covington+10

Kinematics are measured from spectra and the effects of seeing are modeled

slide-10
SLIDE 10

Redshift ---------------------------------------------------------->

Stellar M Mass T Tully-F y-Fisher R Relation S Since ce z z=1.2

slide-11
SLIDE 11

log10 Vrot

log10 M* (M)

Generally On y Only W y Well-Or

  • Ordered G

Galaxies L Lie o

  • n R

Ridgeline

6” 0.65 < < z z < < 0 0.925

  • =
  • = disturbed o
  • r co

compact ct m morphology

  • = n

normal m morphology y

slide-12
SLIDE 12

New Ki Kinematic Q c Quantity t y to Trace Galaxy Potential Wells

(Binney & Tremaine 1987; Weiner et al. 2006)

S0.5

2 ≡ 0.5Vrot 2 + σg 2

slide-13
SLIDE 13

Stellar Mass Tully-Fisher Relation

Faber-Jackson from Gallazzi+06

SAK+07

log S0.5=a + b log M* c=intrinsic scatter <-------------------------------------------------------------------time log10( ) (km s-1)

S0.5 = 0.5V 2 +σ g

2

slide-14
SLIDE 14

Creating a a M Mass-L

  • Limited S

Sample

9.8 < < l log M M* ( (M) < < 1 10.7 ¡

slide-15
SLIDE 15

Kinematic Evolution of the Mass Limited Sample

Decrease in σg (5.0σ significance) Increase in Vrot(4.2σ) and S0.5 (3.6σ) with time.

Blue galaxies become more ordered and increase in potential well depth

  • ver the last 8 billion years.

(9.8 < log M* (M) < 10.7) ¡

time time time

SAK+12b

slide-16
SLIDE 16

Kinematic Evolution of the Mass Limited Sample

(9.8 < log M* (M) < 10.7) ¡

Decrease in σg/S0.5(5.0σ) and Increase in Vrot/S0.5 (3.0σ) with time

Blue galaxies become more ordered and increase in potential well depth

  • ver the last 8 billion years.

time time

SAK+12b

slide-17
SLIDE 17

“Kinematic Downsizing”

Higher mass galaxies are the most evolved at all z (higher Vrot, lower σg). Lower mass galaxies are the least evolved at all z (lower Vrot, higher σg).

(M* limited sample: 9.8 < log M* (M) < 10.7) ¡

SAK+12b

slide-18
SLIDE 18

6”

When is a disk galaxy settled?

Settled: V/σg > 3 Not Settled: V/σg < 3

SAK+12b

slide-19
SLIDE 19

Fraction of Settled Galaxies with Redshift

  • fsettled fraction of

galaxies with V/σg > 3

  • Settled fraction

increases with time

  • The more massive a

galaxy population is, the more settled it is at any z

  • Same qualitative

behavior for thresholds 1 < V/σg < 4

SAK+12b

slide-20
SLIDE 20

What Processes Cause Disk Settling/Formation?

  • 1. Mergers, minor & major, rile up disks (e.g., Covington+10).
  • 2. Mass accretion might also disturb disks (e.g., Bournaud+11,

Cacciato+12) Galaxies likely had larger gas reservoirs in the past:

  • 3. Should cause more SF => more feedback
  • 4. Violent disk instabilities (e.g., Bournaud+11, Cacciato+12)

The process(es) responsible need to decline earlier in more massive systems.

slide-21
SLIDE 21

Conclusions

  • 1. Most disk galaxies not in their final state at z~1.
  • they have significant disturbed motions and morphologies
  • 2. Galaxies increase in Vrot & S0.5 and decrease in σg with time.
  • 3. The more massive a galaxy is, the more kinematically ordered it is

at any time.

We are essentially seeing the creation of the Hubble Sequence for disk galaxies. What roles do minor/major mergers, feedback, and accretion play? How can simulations or SAMs be used to figure this out?

slide-22
SLIDE 22

Comparison to other surveys of blue galaxy kinematics

SAK+12b

Log M M* ( (M) > > 1 10.3 Log M M* ( (M) < < 1 10.3 no M M* m measurement