
SLIDE 1
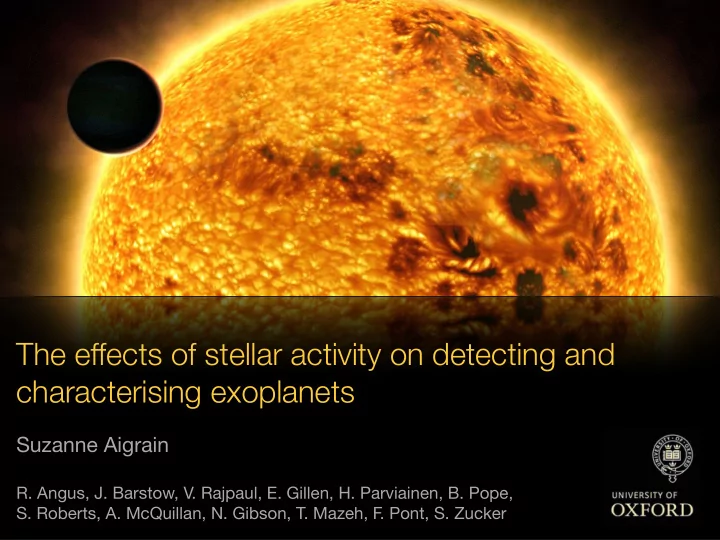
The effects of stellar activity on detecting and characterising exoplanets
Suzanne Aigrain
- R. Angus, J. Barstow, V. Rajpaul, E. Gillen, H. Parviainen, B. Pope,
- S. Roberts, A. McQuillan, N. Gibson, T. Mazeh, F