
SLIDE 1
- Analysis. Answers.
- Analysis. Answers
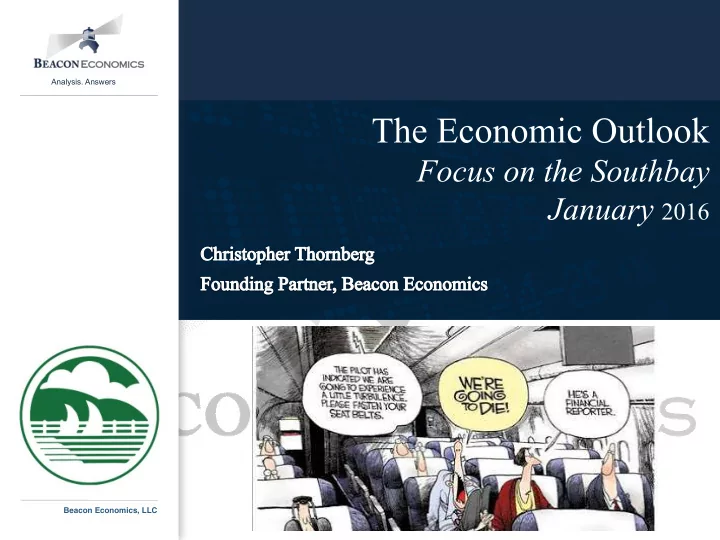
The Economic Outlook
Focus on the Southbay January 2016
The Economic Outlook Focus on the Southbay January 2016 Beacon - - PowerPoint PPT Presentation
Analysis. Answers The Economic Outlook Focus on the Southbay January 2016 Beacon Economics, LLC Analysis. Answers. The Wrong Question Analysis. Answers. 2 The Right Answer US Economy Picking up Steam 2015: Be?er than it looked
The Economic Outlook
Focus on the Southbay January 2016
The Wrong Question
2
The Right Answer
– 2015: Be?er than it looked – Labor markets have turned a corner – Forget the market turmoil: we are not in a bubble – Housing sGll chugging along – Credit expanding on many levels – Commodity prices are down – California leading the charge
– State and Local Budgets sGll stressed – Global economy—parGcularly Asia – Bad Financial RegulaGons – Frothy markets could become an issue – Growing Inequality / PoliGcal Gridlock – Local housing issues
3
2015: Better that it looks
4
2015 Beacon 2013 2014 2015 I II III IV GDP 2.45 2.53 2.09 0.60 3.90 2.10 1.76 Final Demand 1.64 3.11 2.75 1.65 3.70 2.91 2.98 Personal consump@on 1.56 2.16 1.98 1.19 2.42 2.05 2.26 Durable goods 0.34 0.53 0.48 0.14 0.57 0.47 0.74 Nondurable goods 0.41 0.36 0.41 0.10 0.62 0.58 0.33 Services 0.82 1.27 1.09 0.94 1.23 1.00 1.20 Gross investment 1.15 0.80 0.77 1.39 0.85
0.89 Structures 0.18 0.14
0.18
Equipment 0.23 0.30 0.24 0.14 0.03 0.55 0.24 IPP 0.13 0.25 0.20 0.29 0.33
0.21 ResidenGal 0.11 0.16 0.30 0.32 0.30 0.24 0.32 Change inventories 0.52
0.01 0.87 0.02
Net exports 0.29
0.18
Exports 0.68 0.32
0.64 0.11
Imports
Government
0.07 0.31
0.46 0.29 0.49 Federal
0.08 0.08 0.00 0.01 0.21 State and local
0.12 0.24
0.46 0.29 0.28
Consumer Spending
5
0.0% 0.5% 1.0% 1.5% 2.0% 2.5% 3.0% 3.5% 4.0% Jan-12 Jun-12 Nov-12 Apr-13 Sep-13 Feb-14 Jul-14 Dec-14 May-15 Oct-15
Real Consumer Spending Growth
0.0% 0.5% 1.0% 1.5% 2.0% 2.5% 3.0% 3.5% 4.0% 4.5% 5.0% Jan-12 May-12 Sep-12 Jan-13 May-13 Sep-13 Jan-14 May-14 Sep-14 Jan-15 May-15 Sep-15
Real Consumer Spending by Type
Goods Services
Consumer Spending
6
3.5% 4.0% 4.5% 5.0% 5.5% 6.0% Feb-13 May-13 Aug-13 Nov-13 Feb-14 May-14 Aug-14 Nov-14 Feb-15 May-15 Aug-15
Household Savings Rate % of DPI
6000 8000 10000 12000 14000 16000 18000 Jan-04 Jan-05 Jan-06 Jan-07 Jan-08 Jan-09 Jan-10 Jan-11 Jan-12 Jan-13 Jan-14 Jan-15
Auto and Light Truck Unit Sales SAAR
Labor Markets
7
0.0 2.0 4.0 6.0 8.0 10.0 12.0 14.0 16.0 18.0 Jan-05 Dec-05 Nov-06 Oct-07 Sep-08 Aug-09 Jul-10 Jun-11 May-12 Apr-13 Mar-14 Feb-15
Unemployment Rate(s)
Headline U-6
50 100 150 200 250 300 350 Jan-11 Jun-11 Nov-11 Apr-12 Sep-12 Feb-13 Jul-13 Dec-13 May-14 Oct-14 Mar-15 Aug-15
Change in Payrolls (3 Month MA)
Consumer Credit
8
5 10 15 20 25 Jan-12 May-12 Sep-12 Jan-13 May-13 Sep-13 Jan-14 May-14 Sep-14 Jan-15 May-15 Sep-15
Change Consumer Credit ($Bil, 3 Month MA)
9.0 9.5 10.0 10.5 11.0 11.5 12.0 12.5 13.0 06:Q1 06:Q4 07:Q3 08:Q2 09:Q1 09:Q4 10:Q3 11:Q2 12:Q1 12:Q4 13:Q3 14:Q2 15:Q1
Outstanding Consumer Debt $Trillions
Consumer Credit
9
9 10 11 12 13 14 15 16 17 18 19 1980Q1 1982Q2 1984Q3 1986Q4 1989Q1 1991Q2 1993Q3 1995Q4 1998Q1 2000Q2 2002Q3 2004Q4 2007Q1 2009Q2 2011Q3 2013Q4
Debt Servicing as Share DPI
FOB DSR 500 550 600 650 700 750 800 99:Q2 01:Q2 03:Q2 05:Q2 07:Q2 09:Q2 11:Q2 13:Q2 15:Q2
Credit Score at Origina@on
Median 25th percenGle 10th percenGle
Student Loan Crisis?
10
Mil. Share 2009 Coh.
2014Q4
# Debt Del. Rate.
<$5k
9.03 2.0% 33.5%
$5k and $10k
7.79 4.8% 28.5%
$10k and $25k
12.35 18.3% 23.5%
$25k and $50k
8.00 24.5% 20.7%
$50k and $100k
4.36 25.6% 20.6%
$75k and $100k
1.24 9.2% 20.6%
$100k+
1.82 24.9% 17.6%
Total
44.58
Avg
$27,000
Median
$17,000
Breaking It Down by Borrower
2 4 6 8 10 12 14 16 03:Q1 03:Q4 04:Q3 05:Q2 06:Q1 06:Q4 07:Q3 08:Q2 09:Q1 09:Q4 10:Q3 11:Q2 12:Q1 12:Q4 13:Q3 14:Q2 15:Q1
Share Loans 90 Days Late by Type
MORTGAGE HELOC AUTO CC STUDENT LOAN
Degrees Among 21-27 with Bachelor
11 Diploma’s Awarded PSYCHOLOGY 289,968 BUSINESS MANAGEMENT AND A 217,369 BIOLOGY 178,560 GENERAL BUSINESS 171,875 NURSING 170,595 COMMUNICATIONS 162,915 MARKETING AND MARKETING R 160,309 ACCOUNTING 146,322 ENGLISH LANGUAGE AND LITE 132,367 CRIMINAL JUSTICE AND FIRE 123,509 POLITICAL SCIENCE AND GOV 123,106 FINANCE 123,068 Annual Income PETROLEUM ENGINEERING 55,103 COMPUTER ENGINEERING 50,542 CHEMICAL ENGINEERING 48,668 COMPUTER SCIENCE 46,060 AEROSPACE ENGINEERING 44,651 INDUSTRIAL AND ORGANIZATI 43,804 MECHANICAL ENGINEERING 43,495 ELECTRICAL ENGINEERING 42,238 MATHEMATICS AND COMPUTER 41,640 PHARMACY PHARMACEUTICAL S 40,933 OPERATIONS LOGISTICS AND 40,840 FINANCE 40,236
Production
12
46 48 50 52 54 56 58 60 62 64 66 Jan-12 May-12 Sep-12 Jan-13 May-13 Sep-13 Jan-14 May-14 Sep-14 Jan-15 May-15 Sep-15
ISM Indexes to November
Manufacturing Other 95 97 99 101 103 105 107 109 Jan-11 Jun-11 Nov-11 Apr-12 Sep-12 Feb-13 Jul-13 Dec-13 May-14 Oct-14 Mar-15 Aug-15
Industrial Produc@on to November
Total Manufacturing
Production Breakdown
13
0.0% 5.0% 10.0%
Primary metal Mining Apparel Electric Machinery Fabr metal Paper Total index Aerospace Wood product Computer TexGles Chemical Food PrinGng PlasGcs Furniture Petroleum Nonmetallic Electrical eq Motor vehiclesY-o-Y Growth by Sector
30 50 70 90 110 130 150 Jan-08 Sep-08 May-09 Jan-10 Sep-10 May-11 Jan-12 Sep-12 May-13 Jan-14 Sep-14 May-15
Industrial Indexes Oil and Gas
Oil Gas ExtracGon Oil Gas Drilling
Oil Activity
14
3000 4000 5000 6000 7000 8000 9000 10000 Jan-05 Feb-06 Mar-07 Apr-08 May-09 Jun-10 Jul-11 Aug-12 Sep-13 Oct-14
Oil Produc@on Per Day (000s Barrels)
$20 $40 $60 $80 $100 $120 5 10 15 20 25 30 35 Estimated peak cumulative production, mm barrels per day Source: Goldman Sachs, "400 projects to change the world", JPMAM. 2014.Shale oil era has reduced estimated future marginal costs
Breakeven cost for new projects, USD per barrel
2014 2013 2012 2011 2010 2009 2014 with cost deflation impact External Environment
15
0.9 0.92 0.94 0.96 0.98 1 1.02
Jan-10 Jul-10 Jan-11 Jul-11 Jan-12 Jul-12 Jan-13 Jul-13 Jan-14 Jul-14 Jan-15 Jul-15
Trade Flows to October
Nominal Deficit Price Exports / Imports
Goods Trade Balance Balance YTD 14 YTD 15 Ch Canada
16.7 Netherlands 18.6 19.8 1.2 India
0.9 Belgium 11.7 12.2 0.5 Japan
Taiwan
Germany
France
UK 0.1
Italy
Korea, South
Mexico
Brazil 11 3.9
China
Europe
16
0.0% 2.0% 4.0% 6.0% 8.0% 10.0% Dec-94 Dec-96 Dec-98 Dec-00 Dec-02 Dec-04 Dec-06 Dec-08 Dec-10
EU Industrial Produc@on Growth
6.0 7.0 8.0 9.0 10.0 11.0 12.0 13.0 Jan-00 Jan-02 Jan-04 Jan-06 Jan-08 Jan-10 Jan-12 Jan-14
EU Unemployment Rate to October
0.0% 2.0% 4.0% 6.0% 8.0% 10.0% 12.0% 14.0% Jan-02 Jan-03 Jan-04 Jan-05 Jan-06 Jan-07 Jan-08 Jan-09 Jan-10 Jan-11 Jan-12 Jan-13 Jan-14 Jan-15
Y-o-Y Growth Bank Loans to Oct (Non-Gov or MFI)
China Figures
17
2 4 6 8 10 12 Oct-12 Feb-13 Jun-13 Oct-13 Feb-14 Jun-14 Oct-14 Feb-15 Jun-15
China IP Growth Y-o-Y
Chinese Trade
Year-over-Year Percent Change, 3-Month Moving Average Exports: Sep @ -5.9% Imports: Sep @ -14.1% Housing Markets
18
2500 3000 3500 4000 4500 5000 5500 6000 6500 7000 7500 Jan-01 Jan-02 Jan-03 Jan-04 Jan-05 Jan-06 Jan-07 Jan-08 Jan-09 Jan-10 Jan-11 Jan-12 Jan-13 Jan-14 Jan-15
Exis@ng Home Sales to Oct
0.0% 5.0% 10.0% 15.0% 20.0% Jan-05 Dec-05 Nov-06 Oct-07 Sep-08 Aug-09 Jul-10 Jun-11 May-12 Apr-13 Mar-14 Feb-15
Median Price Growth (Y-o-Y
Case-Shiller Regional Price Trends
19
13-14 14-15 Diff 13-14 14-15 Diff OR-Portland 6.2% 11.0% 4.8% AZ-Phoenix 2.2% 5.7% 3.5% CA-San Francisco 9.5% 10.9% 1.5% Composite-20 4.4% 5.6% 1.1% CO-Denver 7.1% 10.9% 3.7% MI-Detroit 3.6% 5.3% 1.6% TX-Dallas 7.7% 9.3% 1.6% MA-Boston 4.3% 5.2% 0.9% WA-Sea?le 6.2% 8.8% 2.6% Na@onal-US 4.6% 5.2% 0.5% FL-Miami 9.5% 8.0% -1.5% NC-Charlo?e 2.7% 4.7% 2.0% FL-Tampa 6.1% 6.4% 0.3% MN-Minneapolis 2.1% 4.0% 2.0% CA-San Diego 4.7% 6.3% 1.6% NY-New York 1.8% 3.1% 1.3% CA-Los Angeles 4.9% 6.1% 1.3% OH-Cleveland 0.8% 2.2% 1.5% GA-Atlanta 4.4% 6.1% 1.6% DC-Washington 2.0% 1.7% -0.3% NV-Las Vegas 7.8% 5.8% -2.1% IL-Chicago 1.8% 1.4% -0.4%
Affordability vs Access
20
0.0% 10.0% 20.0% 30.0% 40.0% 50.0% 60.0% 70.0% 1977 1981 1985 1989 1993 1997 2001 2005 2009 2013
Affordability
50 100 150 200 250 300 350 400 03:Q1 03:Q4 04:Q3 05:Q2 06:Q1 06:Q4 07:Q3 08:Q2 09:Q1 09:Q4 10:Q3 11:Q2 12:Q1 12:Q4 13:Q3 14:Q2 15:Q1
Origina@ons (Bil) by Credit Score to Q3
<620 620-659 660-719 720-779 780+
Construction
21
200 400 600 800 1,000 1,200 1,400 1,600 1,800 2,000 Jan-03 Jan-04 Jan-05 Jan-06 Jan-07 Jan-08 Jan-09 Jan-10 Jan-11 Jan-12 Jan-13 Jan-14 Jan-15
Housing Starts
Single Family 5 Units Plus 200 400 600 800 1000 1200 1400 Jan-05 Jan-06 Jan-07 Jan-08 Jan-09 Jan-10 Jan-11 Jan-12 Jan-13 Jan-14 Jan-15
New Home Sales to Oct
Improved Outlook
22
500 1000 1500 2000 2500 May-02 May-03 May-04 May-05 May-06 May-07 May-08 May-09 May-10 May-11 May-12 May-13 May-14 May-15
Change in Households (2 year Smoothed)
8.0% 8.5% 9.0% 9.5% 10.0% 10.5% 11.0% 11.5% Q1-97 Q2-98 Q3-99 Q4-00 Q1-02 Q2-03 Q3-04 Q4-05 Q1-07 Q2-08 Q3-09 Q4-10 Q1-12 Q2-13 Q3-14
Year Round Vacant as % of Housing Stock to Q3 (Census HVS)
FHA Stats
23
FHA SF Purchase Mortgage Endorsements, First-Time Home Buyers
15,000 25,000 35,000 45,000 55,000 65,000 75,000 85,000 95,000 Oct-07 Feb-08 Jun-08 Oct-08 Feb-09 Jun-09 Oct-09 Feb-10 Jun-10 Oct-10 Feb-11 Jun-11 Oct-11 Feb-12 Jun-12 Oct-12 Feb-13 Jun-13 Oct-13 Feb-14 Jun-14 Oct-14 Feb-15 Jun-15 What inning is it?
24
There is no Bubble… (at least not yet) Why?
driven by fundamentals, not speculaGon
is driving interest rates, not Fed policy
balance
1600 1700 1800 1900 2000 2100 2200
29Oct2013 22Dec2013 14Feb2014 9Apr2014 2Jun2014 26Jul2014 18Sep2014 11Nov2014 4Jan2015 27Feb2015 22Apr2015 15Jun2015 8Aug2015 1Oct2015 24Nov2015
S&P 500 Index
ProRits and Prices
25
500 1000 1500 2000 2500 1996I II III IV 2001I II III IV 2006I II III IV 2011I II III IV
Corporate and Proprietors Profits (Real)
Corporate Proprietors 0.0% 2.0% 4.0% 6.0% 8.0% 10.0% 12.0% 1985I 1987I 1989I 1991I 1993I 1995I 1997I 1999I 2001I 2003I 2005I 2007I 2009I 2011I 2013I 2015I
Profits as Share Gross Na@onal Income to Q3
Gross Net of Taxes
Equity Fundamentals
26
0.0 5.0 10.0 15.0 20.0 25.0 30.0 35.0 Jan-95 Jan-97 Jan-99 Jan-01 Jan-03 Jan-05 Jan-07 Jan-09 Jan-11 Jan-13 Jan-15
Forward Looking P/E Ra@o
0.0% 2.0% 4.0% 6.0% 8.0% Jan-95 Jan-97 Jan-99 Jan-01 Jan-03 Jan-05 Jan-07 Jan-09 Jan-11 Jan-13 Jan-15
Equity Earnings Spread
What about Tech?
27
Tech P/Es
1000 2000 3000 4000 5000 6000 Q1-96 Q2-97 Q3-98 Q4-99 Q1-01 Q2-02 Q3-03 Q4-04 Q1-06 Q2-07 Q3-08 Q4-09 Q1-11 Q2-12 Q3-13 Q4-14
Commercial Real Estate
28
5 6 7 8 9 10 11 Q3-05 Q3-06 Q3-07 Q3-08 Q3-09 Q3-10 Q3-11 Q3-12 Q3-13 Q3-14
Na@onal Cap Rates (REIS)
Apartment Office Retail 1 2 3 4 5 6 7 8 Q3-05 Q3-06 Q3-07 Q3-08 Q3-09 Q3-10 Q3-11 Q3-12 Q3-13 Q3-14
Cap Rate Spreads (REIS – 10 Yr)
Apartment Office Retail
Risk Factors
29
0.0% 20.0% 40.0% 60.0% 80.0% 100.0% 120.0% 140.0% 1985Q1 1986Q2 1987Q3 1988Q4 1990Q1 1991Q2 1992Q3 1993Q4 1995Q1 1996Q2 1997Q3 1998Q4 2000Q1 2001Q2 2002Q3 2003Q4 2005Q1 2006Q2 2007Q3 2008Q4 2010Q1 2011Q2 2012Q3 2013Q4 2015Q1
Debt Outstanding as % GDP to Q3
Household Business Finance Foreign
When How Fast
30
0.0% 1.0% 2.0% 3.0% 4.0%
PCE Infla@on (Y-o-Y) to Oct
0.0% 2.0% 4.0% 6.0% 8.0% 10.0% 12.0% 14.0% Jan-70 Jan-75 Jan-80 Jan-85 Jan-90 Jan-95 Jan-00 Jan-05 Jan-10 Jan-15
M2 Growth (3 Year)
Limited Space to Turn
31
0.0 2.0 4.0 6.0 8.0 10.0 12.0 Jan-85 Jan-87 Jan-89 Jan-91 Jan-93 Jan-95 Jan-97 Jan-99 Jan-01 Jan-03 Jan-05 Jan-07 Jan-09 Jan-11 Jan-13 Jan-15
Interest Rates
FFR 10 Yr Treasury
0.00 1.00 2.00 3.00 4.00 5.00 Jan-85 Jan-88 Jan-91 Jan-94 Jan-97 Jan-00 Jan-03 Jan-06 Jan-09 Jan-12 Jan-15
Spread
California fact versus Riction
32
California Hype: § High taxes, Over regulated § People/business fleeing Reality § Business Climate is not that important § State still outperforming § Certain industries more vulnerable than
§ Real enemy: CEQA, dumb taxes
“Looking back a few years (2009 / 2010) everyone was saying that CA would fail like Greece or Detroit, but things look different now. What has happened to turn things around?”
Regional Employment Growth
33
100 105 110 115 120 125 130 135 Jan-95 Oct-96 Jul-98 Apr-00 Jan-02 Oct-03 Jul-05 Apr-07 Jan-09 Oct-10 Jul-12 Apr-14
Index Payroll Employment
California Balance US
3 Yr Growth: Total Gr A/D Utah 3.3% 1.1% Nevada 3.1% 0.4% California 3.0% 0.1% Florida 3.0% 0.5% Colorado 3.0%
Idaho 2.9% 0.4% Texas 2.8%
Washington 2.8% 1.0% Oregon 2.7% 0.8% North Dakota 2.5%
Georgia 2.5% 0.1% South Carolina 2.4% 0.4% Delaware 2.2%
North Carolina 2.2% 0.3% Michigan 2.2% 0.1% Arizona 2.0% 0.1% Tennessee 1.9% 0.4%
Employment Growth
34
California Employment Growth by Metro Region Nov-15 Change (000s) YoY Change (%) San Jose 1,074.6 51.9 5.1 San Francisco (MD) 1,069.7 41.7 4.1 San Luis Obispo 115.7 4.2 3.8 Inland Empire 1,349.0 45.4 3.5 San Diego 1,404.0 37.3 2.7 Orange County 1,553.7 38.3 2.5 Los Angeles (MD) 4,342.6 72.0 1.7 Oakland (MD) 1,096.1 17.8 1.7 Bakersfield 261.9 0.6 0.2 California 16,258.0 417.1 2.6
0.0 2.0 4.0 6.0 8.0 10.0 12.0 14.0 16.0 Jan-04 May-05 Sep-06 Jan-08 May-09 Sep-10 Jan-12 May-13 Sep-14 Percent (SA)
Unemployment Rate
Inland Empire Orange County Los Angeles
L.A. County Industries
35
Industry Nov-15
Total Nonfarm 4,342.6 1.7 ConstrucGon 129.8 4.9 Leisure and Hospitality 492.6 4.1 EducaGon/Health 781.4 3.0 Prof Sci and Tech 292.8 2.7 Real Estate 78.5 2.6 Admin Support 271.1 2.6 Wholesale Trade 232.7 2.5 Other Services 157.7 2.4 Management 61.4 2.0 State Government 87.2 1.1 Retail Trade 422.3 0.8 Transport,Warehouse,UGl. 165.7 0.4 Farm 5.3 0.3 Finance and Insurance 131.2
Manufacturing 357.9
InformaGon 190.3
NR/Mining 4.3
Industry
Total Nonfarm 72.0 1.70 EducaGon/Health 22.8 0.53 Leisure and Hospitality 19.5 0.46 Prof Sci and Tech 7.6 0.18 Admin Support 6.8 0.16 ConstrucGon 6.1 0.14 Wholesale Trade 5.6 0.13 Other Services 3.6 0.09 Retail Trade 3.5 0.08 Real Estate 2.0 0.05 Management 1.2 0.03 State Government 1.0 0.02 Transport,Warehouse,UGl. 0.7 0.02 Farm 0.0 0.00 NR/Mining
Finance and Insurance
InformaGon
Manufacturing
Fastest Growing Largest Contributors
SB Employment
36
City/County Emp by Res, 2014 (000s) Unemp Rate 2014 (%) PV Peninsula 22.0 2.3 Rancho Palos Verdes 18.0 4.7 Hermosa Beach 11.9 4.8 Manha?an Beach 17.7 5.1 El Segundo 9.0 6.3 Redondo Beach 37.5 6.9 Torrance 71.4 8.1 Lomita 10.8 9.1 Lawndale 15.6 10.1 Hawthorne 39.9 10.3 Gardena 27.0 10.5 Inglewood 48.9 14.6
Total SB 329 8.1
Share of L.A. County Establishments in the South Bay Industry Total Estab. Large Estab. Total 8.6 9.6 Transport/Warehouse 14.5 7.7 Mgmt. 11.6 16.0 Admin Support 9.8 5.0 Finance and Insurance 9.4 5.5 EducaGon 9.4 1.5 Real Estate 9.2 7.7 AccommodaGons 9.1 4.8 Health Care 9.1 7.4 Pro., Sci., Tech. 9.0 14.9 Manufacturing 8.9 18.0 ConstrucGon 8.8 13.8
Local Income
37
Annual Household Income BA (%) City/County 2014 2-Yr. Chg (%) 2014 Rolling Hills 218,600 2.2 71.8 Palos Verdes Estates 171,300 12.7 75.7 Manha?an Beach 142,100 5.7 74.2 Rolling Hills Estates 136,500
68.3 Rancho Palos Verdes 120,700 0.8 64.8 Hermosa Beach 105,000 4.3 71.1 Redondo Beach 103,100 4.3 56.8 El Segundo 84,000
45.0 Torrance 78,300 2.9 45.3 Lomita 57,200
27.5 County Total 55,900
29.9 Lawndale 48,400
15.8 Gardena 47,900
23.7 Hawthorne 44,400
19.1 Inglewood 42,200
17.4 40000 42000 44000 46000 48000 50000 52000 54000 56000 58000 2004 2005 2006 2007 2008 2009 2010 2011 2012 2013 2014
Average Annual Pay La County
Select Major Employers
38
Industry Employer City Manufacturing Aerospace Corp El Segundo Honeywell Torrance Triumph Aerostructures-Vought Hawthorne Space ExploraGon Technologies Hawthorne Robinson Helicopter Torrance Boeing El Segundo InternaGonal Services Inc Torrance Prof., Sci., Tech Honda R&D Americas Inc Torrance QUADRIGA Americas Torrance Pictage Inc Torrance Wholesale Farmer Bros Torrance Canon SoluGons America Gardena Konica Minolta Gardena ConstrucGon Pardee Homes El Segundo WE O'Neil ConstrucGon Co El Segundo Arts Hollywood Park Casino Inglewood
California Tourism
39
50.0 55.0 60.0 65.0 70.0 75.0 80.0 Jan-05 Jul-06 Jan-08 Jul-09 Jan-11 Jul-12 Jan-14
Hotel Occupancy
California United States 2.0 2.5 3.0 3.5 4.0 4.5 5.0 5.5 6.0 6.5 Jan-07 Nov-07 Sep-08 Jul-09 May-10 Mar-11 Jan-12 Nov-12 Sep-13 Jul-14
Passengers
LAX SFO
California International Arrivals Country 2014 Annual Growth (%) China 736,286 23.4 Australia 664,091 6.2 Japan 490,852 4.5 U.K. 475,840 7.9 Mexico 431,471 4.7 France 329,176 25.5 South Korea 320,108 5.8 Germany 271,711 4.4 Taiwan 199,901 20.3 New Zealand 162,000 32.9
Local Spending
40
1 2 3 4 5 6 7 8 9 Q1-13 Q2-13 Q3-13 Q4-13 Q1-14 Q2-14 Q3-14 Q4-14 Q1-15 Q2-15 Q3-15 Year-over-Year (%, SA)
Taxable Sales Growth
Los Angeles California Category 2015 YTD Chg. (%) Autos and TransportaGon 182.8 9.2 Building and ConstrucGon 72.6 7.2 Business and Industry 148.3 2.1 Food and Drugs 62.2 2.9 Fuel and Service StaGons 102.3
General Consumer Goods 253.9 3.4 Restaurants and Hotels 162.7 7.3 Total 1,113.7 2.7
Venture Capital
41
600 1,100 1,600 2,100 2,600 3,100 3,600 4,100 4,600
2008 2009 2010 2011 2012 2013 2014 2015 YTD
Los Angeles/Orange County ($ Millions)
Venture Capital Investment
Los Angeles/Orange County
Industry LA & OC ($M) LA & OC State Share (%) Sovware 1,449.0 11.8 Industrial Energy 1,113.3 57.5 Consumer Prod. and Serv. 381.8 13.1 Media and Entertainment 299.1 14.4 Medical Devices and Equip. 252.8 28.5 IT Services 181.7 11.2 Healthcare Services 92.5 32.8 Biotechnology 73.1 3.0
Commercial Real Estate Markets
42
Inland Empire Orange County Los Angeles Property Q3-15 YoY Change (%) Q3-15 YoY Change (%) Q3-15 YoY Change (%) Cost of Rent
Apt 1,168 4.0 1,724 3.3 1,587 4.3 Office 21.8 1.3 30.1 5.7 35.1 3.8 Retail 21.5 2.3 32.3 2.2 31.2 3.3 Vacancy Rate Apt 2.6
2.8 0.2 3.2 0.0 Office 23.3
16.6
14.9 0.0 Retail 9.3
5.0
6.0
Goods Movement
43
200000 400000 600000 800000 1000000 1200000 1400000 1600000 1800000 Jan-95 May-97 Sep-99 Jan-02 May-04 Sep-06 Jan-09 May-11 Sep-13
Monthly Exported TEU's
Los Angeles Long Beach Commodity 2015 YTD ($M) Chg. (%) Total 97,614 -2.3 Electric Machinery 17,444 6.0 Industrial Machinery 14,128 2.5 OpGc Photo/Medic/Surgical Instruments 9,612 -3.0 Aircrav Spacecrav And Parts Thereof 6,356 5.1 Edible Fruit & Nuts 5,987 7.0 Vehicles 4,705 -12.8 Pearls, Stones, Metals 4,626 -9.4 Mineral Fuel Oil 3,505 -27.9 PharmaceuGcal Products 2,886 -9.4 PlasGcs 2,620 -2.2
California Exports
44
Share Growth 2009-2015 Est
TOTAL ALL INDUSTRIES Computer And Electronic Products 19.8% Agricultural Products 12.6% Machinery, Except Electrical 10.6% TransportaGon Equipment 10.3% Miscellaneous Manufactured 10.3% Electrical Equipment 7.3% Chemicals 6.6% Used Or Second-Hand Merchandise 5.7% Food And Kindred Products 4.9% Petroleum And Coal Products 4.7% Primary Metal Manufacturing 2.7% Fabricated Metal Products, Nesoi 1.8% Beverages And Tobacco Products 1.6% PlasGcs And Rubber Products 1.5% Apparel And Accessories 1.3%
20 40 60 80 100 120 140 160 180 200 Billions
CA Exports
Ag and the Drought
45
330,000 340,000 350,000 360,000 370,000 380,000 390,000 400,000 410,000 420,000 430,000 Jan-01 Mar-02 May-03 Jul-04 Sep-05 Nov-06 Jan-08 Mar-09 May-10 Jul-11 Sep-12 Nov-13 Jan-15
California Farm Employment
0.0% 0.5% 1.0% 1.5% 2.0% 2.5% $0 $5 $10 $15 $20 $25 $30
Farm Earnings
Farm Earnings Share State Income
Looking Closer
46
Insurable Crops 2006 2014 6,664,689 6,055,791 Forage ProducGon 1,060,000 930,000 Almonds 580,000 860,000 Wheat 530,000 585,000 Grapes (Wine) 445,147 570,000 Rice 526,000 495,000 Corn 540,000 430,000 Co?on 600,000 315,000 Walnuts 215,000 290,000 Tomatoes 306,465 288,000 Citrus – 8 types 267,913 270,000
20 40 60 80 100 120 140
CA Exports of Alfalfa (Millions KG)
Alfalfa Rice Nuts
$0.27 $0.79 $7.07
$ / Kg
47
Homes and Workers
0.0% 1.0% 2.0% 3.0% 4.0% 5.0% Jan-94 Jun-96 Nov-98 Apr-01 Sep-03 Feb-06 Jul-08 Dec-10 May-13
Workforce Trends
Payroll Labor Force
200,000 300,000 400,000 500,000 600,000 700,000 Jan-02 Apr-03 Jul-04 Oct-05 Jan-07 Apr-08 Jul-09 Oct-10 Jan-12 Apr-13 Jul-14
Median Home Prices
Southern California Bay Area US
Residential Real Estate
48
100,000 200,000 300,000 400,000 500,000 600,000 700,000 800,000 Q1-05 Q1-06 Q1-07 Q1-08 Q1-09 Q1-10 Q1-11 Q1-12 Q1-13 Q1-14 Q1-15 USD $
Median Home Prices
IE LA OC 900 1,000 1,100 1,200 1,300 1,400 1,500 1,600 1,700 1,800 Q1-05 Q4-05 Q3-06 Q2-07 Q1-08 Q4-08 Q3-09 Q2-10 Q1-11 Q4-11 Q3-12 Q2-13 Q1-14 Q4-14 Q3-15 USD $ per Month
Apartment Rents
IE LA OC
Bubble? No…
49
0.0 10.0 20.0 30.0 40.0 50.0 60.0
Total Housing Costs (% of Med. HH. Income)
California Housing Affordability % Over Crowded % Vacant Hawaii 8.6% Utah 5.1% California 8.2% Minnesota 5.2% Alaska 6.5% California 5.3% New York 5.0% Vermont 5.4% Texas 4.8% Colorado 5.5% Arizona 4.5% Massachuse?s 5.6% Nevada 4.2% New Hampshire 5.6% New Mexico 3.6% Wisconsin 5.8% DC 3.3% Oregon 6.0% Utah 3.3% Washington 6.4% Oregon 3.3% Idaho 6.4%
Pace of Construction
50
2000 4000 6000 8000 10000 12000 14000 16000 Jan-95 Sep-96 May-98 Jan-00 Sep-01 May-03 Jan-05 Sep-06 May-08 Jan-10 Sep-11 May-13 Jan-15
California Permits
Single-Family MulG-Family
California 4.1 Tulare 4.0 Ventura 6.8 Los Angeles 4.0 Contra Costa 6.6 Fresno 4.0 Sonoma 6.1 San Mateo 3.4 Alameda 5.9 Kern 3.0 Santa Barbara 5.3 Santa Clara 3.0 San Bernardino 5.0 Orange Cnty 2.8 Solano 4.6 Placer 2.1 Riverside 4.5 San Fran 2.1 San Diego 4.2 Sacramento 0.7
New Pop / Permits
Why the Shortage?
51
Under $25,000
$25,000 to $50,000
$50,000 to $99,999 18,955 Over $100,000 2,619 Total
Total DomesGc Net MigraGon by Income 08-13
Texas Under $25,000
$25,000 to $50,000
$50,000 to $99,999
Over $100,000 599
Construction
52
200 400 600 800 1,000 1,200 1,400 1,600 1,800 2,000 1,000 2,000 3,000 4,000 5,000 6,000 7,000 Q1-08 Q4-08 Q3-09 Q2-10 Q1-11 Q4-11 Q3-12 Q2-13 Q1-14 Q4-14 Q3-15 Nonresiden@al Values (SA) Residen@al Units (SA)
Los Angeles Building Permits
ResidenGal Units NonresidenGal Values
Los Angeles County ResidenGal Building Permits Permit Type 2014 YTD 2015 YTD Chg. (%) Single- Family 4,031 3,970
MulG-Family 13,100 17,386 32.7 Total ResidenGal 17,131 21,356 24.7
Local Real Estate
53
20 40 60 80 100 120 140 160
Monthly Residen@al Units Permijed
South Bay CiGes (Units)
Median Home Price,
2015 Change (%) El Segundo 1,171 37.3 Gardena 413 4.7 Hawthorne 519 4.8 Hermosa Beach 1,562 57.4 Inglewood 371 6 Lawndale 521 20.3 Lomita 535 9.1 Manha?an Beach 1,831
Rancho Palos Verdes 945
Redondo Beach 860 8.9 Torrance 585 2
Nonresidential Construction
54
Nonresiden@al Permits by Category, in $M Los Angeles Orange County Category 2014 2015YTD 2014 2015YTD New Commercial 1,895 1,664 713 474 Office 267 342 72 20 Retail 732 436 367 99 Hotel 359 250 43 85 RecreaGonal 54 124 56 40 Parking Garages 470 494 173 229 Industrial 121 85 155 87 Other Nonres. 1,041 554 62 55 Non-Structures 831 274 27 33 Churches 25 25 5 3
3,327 2,481 1,033 967 Total Nonres. 6,383 4,784 1,962 1,583
Income tax driving the show
55 Sales Tax Rate Decline
50 100 150 200 250 300 350 400 1995-96 = 100
Index
PIT CORP SALES
50 60 70 80 90 100 110 120 $Billions
CA Revenues and Expenditures
GF Revenues GF Expenditures
In Summary
What not to worry about.
What to worry about.
56
57
Economic & Revenue Forecasting Regional Intelligence Reports Business & Market Analysis Real Estate Market Analysis Ports & Infrastructure Analysis Economic Impact Analysis Public Policy Analysis v To view or download this presentation
www.BeaconEcon.com v Contact Christopher Thornberg Chris@BeaconEcon.com 310-571-3399
Our Services