The Economic History of the World J. Parman (College of William - - PowerPoint PPT Presentation

the economic history of the world
SMART_READER_LITE
LIVE PREVIEW

The Economic History of the World J. Parman (College of William - - PowerPoint PPT Presentation

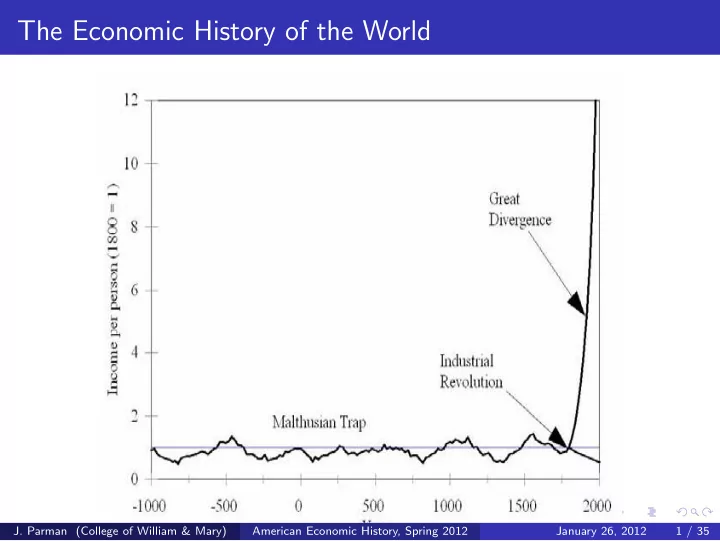
The Economic History of the World J. Parman (College of William & Mary) American Economic History, Spring 2012 January 26, 2012 1 / 35 The Malthusian Trap The Malthusian Trap is a situation in which an economy is stuck at a particular


slide-1
SLIDE 1

The Economic History of the World

  • J. Parman (College of William & Mary)

American Economic History, Spring 2012 January 26, 2012 1 / 35

slide-2
SLIDE 2

The Malthusian Trap

The Malthusian Trap is a situation in which an economy is stuck at a particular income per person. The basic logic is the following:

Suppose there is a rise in income per person (maybe because technology improved) Higher income levels lead to more births and fewer deaths Population grows Output grows but output per worker falls until income per person is back at its original level

The problem is that limited resources mean output can’t grow as fast as population

  • J. Parman (College of William & Mary)

American Economic History, Spring 2012 January 26, 2012 2 / 35

slide-3
SLIDE 3

America as the Exception to the Rule

35000 300000 population 15000 20000 25000 30000 100000 150000 200000 250000 capita (1996 dollars) lation (thousands) population GDP per capita 5000 10000 50000 100000 1650 1700 1750 1800 1850 1900 1950 2000 GDP per Popul

  • J. Parman (College of William & Mary)

American Economic History, Spring 2012 January 26, 2012 3 / 35

slide-4
SLIDE 4

America as the Exception to the Rule

12 13 7 8 9 10 11 12 ln(population) ln(GDP per capita) 4 5 6 7 1650 1700 1750 1800 1850 1900 1950 2000

  • J. Parman (College of William & Mary)

American Economic History, Spring 2012 January 26, 2012 4 / 35

slide-5
SLIDE 5

America as the Exception to the Rule

The United States has a unique history among developed economies When America was colonized, the rest of the world was very much stuck in a Malthusian trap However, the colonies managed to experience rapid population growth without declining output per person One reason was America’s unique abundance of natural resources

  • J. Parman (College of William & Mary)

American Economic History, Spring 2012 January 26, 2012 5 / 35

slide-6
SLIDE 6

Growth During the Colonial Period

The colonial period had high population growth rates: population was growing at about 3.5% per year The size of the economy was growing substantially: total output increased by a factor of 10 between 1710 and 1775 Per capita income grew but it grew slowly: output per person increased by roughly one third between 1710 and 1775 The colonies weren’t in a Malthusian trap but they weren’t experiencing modern growth either

  • J. Parman (College of William & Mary)

American Economic History, Spring 2012 January 26, 2012 6 / 35

slide-7
SLIDE 7

Other Ways to Grow

Obviously any economy ultimately runs into natural resource constraints Are there other ways to sustain growth in income per person? There are really only two ways to do it:

Use more inputs per person (for example, build more machines) Use inputs more efficiently (better technology, better allocation of resources, etc.)

  • J. Parman (College of William & Mary)

American Economic History, Spring 2012 January 26, 2012 7 / 35

slide-8
SLIDE 8

Growth From Independence to 1840

Little data leads to lots of stories Standard growth accounting data does not exist Paul David proposed a clever solution that doesn’t require knowing total GDP:

Total output per capita must equal average output per worker times the fraction of the population in the workforce Average output per worker is the weighted average of

  • utput per worker in agriculture and output per worker

in other sectors David assumes productivity in manufacturing relative to productivity in agriculture was constant (strong assumption)

  • J. Parman (College of William & Mary)

American Economic History, Spring 2012 January 26, 2012 8 / 35

slide-9
SLIDE 9

Growth From Independence to 1840

David’s approach gives us a different way of breaking down the sources of growth in output per capita that doesn’t require measuring GDP and the capital stock Output per capita can grow because of any or all of the following (somewhat observable) factors:

A shift of workers from agriculture to other sectors (productivity was higher in other sectors) An increase in agricultural productivity (which by assumption implies an increase in productivity in other sectors) An increase in the labor force participation rate

  • J. Parman (College of William & Mary)

American Economic History, Spring 2012 January 26, 2012 9 / 35

slide-10
SLIDE 10

Growth From Independence to 1840

Decade Shift out of Agriculture Change in Agricultural Productivity Labor Force Participation Rate Total 1800-09

  • 0.009
  • 0.032

0.003

  • 0.038

1810-19 0.039 0.035 0.019 0.095 1820-29 0.066 0.178

  • 0.012

0.240 1830-39 0.055 0.110 0.025 0.200 1840-49 0.061 0.000 0.066 0.131 1850-59 0.011 0.215 0.000 0.228 Sources of Change in Per Capita Output, 1800-1860 Percentage Change Attributable To:

  • J. Parman (College of William & Mary)

American Economic History, Spring 2012 January 26, 2012 10 / 35

slide-11
SLIDE 11

Growth from Independence to 1840

A few reasons to be skeptical: David’s growth in agricultural productivity numbers seem big for a period with little technological advance Many of David’s non-agricultural laborers may have actually been in agriculture Manufacturing productivity was likely growing differently than agricultural productivity

  • J. Parman (College of William & Mary)

American Economic History, Spring 2012 January 26, 2012 11 / 35

slide-12
SLIDE 12

Growth After 1840

We know much more about growth after 1840 because the data gets much better Better data allows us to get good measures of output and to break down growth into growth in labor, capital, land and productivity The main factors in economic growth since 1840 turn

  • ut to be quite different than the main factors before

1840

  • J. Parman (College of William & Mary)

American Economic History, Spring 2012 January 26, 2012 12 / 35

slide-13
SLIDE 13

Growth After 1840

With good data on output, labor and capital we can do standard growth accounting This means calculating the contributions of growth in technology (A), labor (L), capital (K) and natural resources (Z) For growth in total output: gY = gA + agK + bgL + cgZ For growth in output per worker: g Y

L = gA + ag K L + cg Z L

a, b and c represent the share of income that goes to each particular input (if we use a lot of one input, growth in that input will have a big effect on growth in

  • utput)
  • J. Parman (College of William & Mary)

American Economic History, Spring 2012 January 26, 2012 13 / 35

slide-14
SLIDE 14

Growth After 1840

Period Labor Capital Land Output 1840-1860 3.42% 6.57% 3.73% 4.75% 1870-1930 2.24 4.35 2.55 3.75 1940-1990 1.59 3.14 0.34 3.22 Growth Accounting, 1840-1990 Annual Rate of Growth of:

  • J. Parman (College of William & Mary)

American Economic History, Spring 2012 January 26, 2012 14 / 35

slide-15
SLIDE 15

Growth After 1840

Period Labor Capital Land Productivity 1840-1860 49% 26% 10% 15% 1870-1930 43 27 4 27 1940-1990 41 14 45 Growth Accounting, 1840-1990 Percentage of Output Growth Attributable to:

  • J. Parman (College of William & Mary)

American Economic History, Spring 2012 January 26, 2012 15 / 35

slide-16
SLIDE 16

Summarizing American Growth

Population growth has consistently been a big part of

  • verall growth in output

Growth in land remained relevant throughout the 1800s (until the frontier closed) Growth in capital has declined in importance (although growth in capital per worker remains important to growth in output per worker) Growth in productivity has really emerged as the biggest factor in explaining growth in output and output per worker To put things simply, early American growth was all about extensive growth (expanding land and labor supply), modern growth is all about improving productivity

  • J. Parman (College of William & Mary)

American Economic History, Spring 2012 January 26, 2012 16 / 35

slide-17
SLIDE 17

Putting American Economic Growth in Perspective

Rank Country GDP per capita (2010 US dollars) 180 Democratic Republic of Congo 171 179 Liberia 239 178 Sierra Leone 311 145 Kenya 912 United States, 1710 952 144 Nicaragua 972 118 Indonesia 2,329 United States, 1840 2,336 117 Paraguay 2,337 84 Namibia 4,543 United States, 1880 4,585 83 Azerbaijan 4,807 52

  • St. Kitts and Nevis

10,315 United States, 1929 10,640 51 Lithuania 11,172 37 Oman 18,013 United States, 1945 18,079 36 Czech Republic 18,557 10 Austria 45,989 9 United States 46,381 8 United Arab Emirates 46,857 7 Netherlands 48,223 6 Ireland 51,356 5 Denmark 56,115 4 Switzerland 67,560 3 Qatar 68,872 2 Norway 79,085 1 Luxembourg 104,512 International Monetary Fund, World Economic Outlook Database, April 2010

  • J. Parman (College of William & Mary)

American Economic History, Spring 2012 January 26, 2012 17 / 35

slide-18
SLIDE 18

Growth of the Colonial Economy - GDP

350000 400000 150000 200000 250000 300000 350000 usand 1840 dollars 50000 100000 1650 1720 1774 1781 1793 1800 Thou

  • J. Parman (College of William & Mary)

American Economic History, Spring 2012 January 26, 2012 18 / 35

slide-19
SLIDE 19

Growth of the Colonial Economy - Population

2500000 1000000 1500000 2000000 White Black 500000

  • J. Parman (College of William & Mary)

American Economic History, Spring 2012 January 26, 2012 19 / 35

slide-20
SLIDE 20

Growth of the Colonial Economy - GDP per capita

70 30 40 50 60 840 dollars 10 20 1650 1720 1774 1781 1793 1800 18

  • J. Parman (College of William & Mary)

American Economic History, Spring 2012 January 26, 2012 20 / 35

slide-21
SLIDE 21

Why Settle America?

Early exploration of the Americas had a lot to do with mercantilism An oversimplification: countries assumed greater military and political power came from greater stocks of gold and silver The Spanish had success in finding places with gold and silver that could be mined Other countries had to rely on trade to build up stocks

  • f silver and gold

This led countries to seek out colonies that had different resources from the mother country and to set up extractive institutions

  • J. Parman (College of William & Mary)

American Economic History, Spring 2012 January 26, 2012 21 / 35

slide-22
SLIDE 22

Mercantilism and Role of Colonies

Philipp Wilhelm von Hornick, Austria Over All, If She Only Will, 1684 (quoted in Robert Ekelund Jr. and Robert Hebert, A History of Economic Theory and Method, Waveland Press, 1997): That every inch of a country’s soil be utilized for agriculture, mining or manufacturing That all raw materials found in a country be used in domestic manufacture, since finished goods have a higher value than raw materials That a large, working population be encouraged That all export of gold and silver be prohibited and all domestic money be kept in circulation That all imports of foreign goods be discouraged as much as possible

  • J. Parman (College of William & Mary)

American Economic History, Spring 2012 January 26, 2012 22 / 35

slide-23
SLIDE 23

Mercantilism and Role of Colonies

Philipp Wilhelm von Hornick, Austria Over All, If She Only Will, 1684 (quoted in Robert Ekelund Jr. and Robert Hebert, A History of Economic Theory and Method, Waveland Press, 1997): That where certain imports are indispensible they be

  • btained at first hand, in exchange for other domestic

goods instead of gold and silver That as much as possible, imports be confined to raw materials that can be finished [in the home country] That opportunities be constantly sought for selling a country’s surplus manufactures to foreigners, so far as necessary, for gold and silver That no importation be allowed if such goods are sufficiently and suitably supplied at home

  • J. Parman (College of William & Mary)

American Economic History, Spring 2012 January 26, 2012 23 / 35

slide-24
SLIDE 24

Why Settle America if You’re British?

The colonies in the mid-Atlantic didn’t yield gold or silver Initially, British businessmen thought the southern colonies might be good for silk and winemaking That didn’t really pan out, but tobacco did The northern colonies were about subsistence agriculture and port services

  • J. Parman (College of William & Mary)

American Economic History, Spring 2012 January 26, 2012 24 / 35

slide-25
SLIDE 25

Why Settle America if You’re British?

  • J. Parman (College of William & Mary)

American Economic History, Spring 2012 January 26, 2012 25 / 35

slide-26
SLIDE 26

Why Settle America if You’re British?

  • J. Parman (College of William & Mary)

American Economic History, Spring 2012 January 26, 2012 26 / 35

slide-27
SLIDE 27

Mercantilist Policy and the Colonial Economy

Although the colonies didn’t have gold and silver, the colonial economy was very much shaped by mercantilist policy Colonies were supposed to provide England with commodities unavailable in England and to serve as a captive market for English finished products Colonies weren’t supposed to compete with the mother country: you sell your resources to England, not to

  • ther countries, and you buy your finished goods from

England, not from other countries

  • J. Parman (College of William & Mary)

American Economic History, Spring 2012 January 26, 2012 27 / 35

slide-28
SLIDE 28

Mercantilist Policy and the Colonial Economy

These mercantilist policies had very different effects on the southern and northern colonies Southern colonies had land that could be used for tobacco Britain provided a growing market for tobacco, supply

  • f tobacco rose dramatically during the entire colonial

period Northern farmland wasn’t all that good so as population grew, the marginal product of labor dropped Mercantilist policy didn’t leave many manufacturing jobs for these farmers to switch to The one big industry the north did have was shipping (they had timber and lots of things needed to be shipped)

  • J. Parman (College of William & Mary)

American Economic History, Spring 2012 January 26, 2012 28 / 35

slide-29
SLIDE 29

The Colonial Economy

Colonial Workforce by Sector

Shipping Other

Colonial Workforce by Sector

Agriculture

  • J. Parman (College of William & Mary)

American Economic History, Spring 2012 January 26, 2012 29 / 35

slide-30
SLIDE 30

The Colonial Economy

So the colonial economy was dominated by agriculture The good news: there was plenty of land to farm The bad news: to farm all that new land, the colonies needed more people More good news: wages were good in the colonies relative to Britain so people wanted to work in the colonies More bad news: travel from England to the colonies was extremely costly (almost equal to a German migrant’s annual salary) Solution: indentured servitude

  • J. Parman (College of William & Mary)

American Economic History, Spring 2012 January 26, 2012 30 / 35

slide-31
SLIDE 31

Credit Constraints and Indentured Servitude

The cost of passage to America was £5 to £10, an amount greater than average annual income at the time To put that in perspective, think about college tuition:

Average tuition and fees at private four-year colleges is $26,273 Average income for a 18 to 24 years old high school graduate is $26,218 for men, $22,814 for women If there were no student loans, how would people pay for college?

  • J. Parman (College of William & Mary)

American Economic History, Spring 2012 January 26, 2012 31 / 35

slide-32
SLIDE 32

How Indentured Servitude Works - Standard

Laborer and shipper strike a contract trading a period of labor for passage p p g Shipper transports laborer to America pp p Shipper sells the contract to employer in Shipper sells the contract to employer in America After contract is up, servant becomes a free laborer

  • J. Parman (College of William & Mary)

American Economic History, Spring 2012 January 26, 2012 32 / 35

slide-33
SLIDE 33

How Indentured Servitude Works - Redemptioners

Laborer borrows money from the shipper to pay for passage and supplies p y p g pp Shipper transports laborer to the colonies pp p Laborer finds an employer and negotiates a Laborer finds an employer and negotiates a contract long enough to pay back shipper After contract is up, servant becomes a free laborer

  • J. Parman (College of William & Mary)

American Economic History, Spring 2012 January 26, 2012 33 / 35

slide-34
SLIDE 34

How Indentured Servitude Works

  • J. Parman (College of William & Mary)

American Economic History, Spring 2012 January 26, 2012 34 / 35

slide-35
SLIDE 35

How Indentured Servitude Works

This indentured...between [Alexander Beard]...of the one part, and [John Dickey]...of the other part, witnesseth, that the said [Alexander Beard] doth hereby covenant, promise and grant, to ...[John Dickey]...and his assigns, from the day

  • f the date hereof until the first and next arrival at

[Philadelphia] in America...and during the term of [three] years to serve in such service and employment as the said [John Dickey] or [his] assigns shall there employ [him]...In consideration whereof the said [John Dickey] doth grant...to pay for [his] passage, and to find allow [him] meat, drink, apparel and lodging, with other necessaries, during the said term; and at the end of the said term to pay unto him the usual allowance, according to the custom of the country in the like kind...

  • J. Parman (College of William & Mary)

American Economic History, Spring 2012 January 26, 2012 35 / 35