Introduction ECN 110B World Economic History Since the Industrial - - PowerPoint PPT Presentation

introduction
SMART_READER_LITE
LIVE PREVIEW

Introduction ECN 110B World Economic History Since the Industrial - - PowerPoint PPT Presentation

Introduction ECN 110B World Economic History Since the Industrial Revolution J. Parman (UC-Davis) World Economic History, Spring 2011 March 28, 2011 1 / 40 Contact info, office hours John Parman (instructor) Email: jmparman@ucdavis.edu


slide-1
SLIDE 1

Introduction

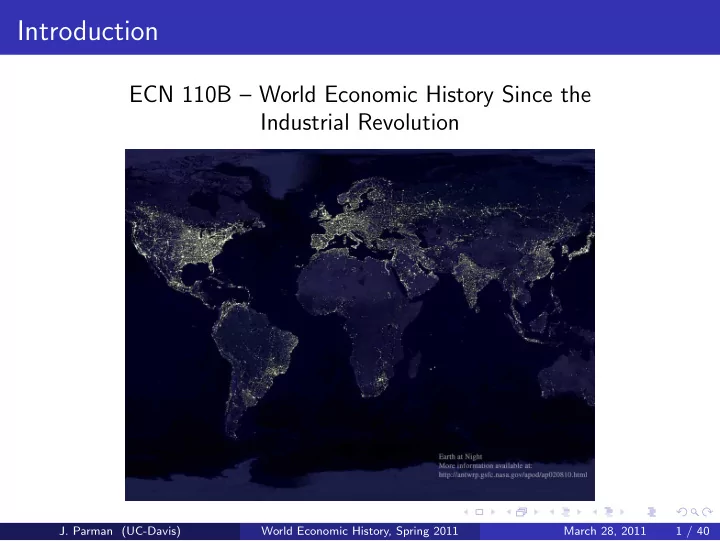
ECN 110B – World Economic History Since the Industrial Revolution

  • J. Parman (UC-Davis)

World Economic History, Spring 2011 March 28, 2011 1 / 40

slide-2
SLIDE 2

Contact info, office hours

John Parman (instructor) Email: jmparman@ucdavis.edu Office: 1125 SSH Office hours: M, W 3pm-5pm Andrew Foote (TA) Email: afoote@ucdavis.edu Office: 120 SSH Office hours: TBA Brock Smith (TA) Email: brosmith@ucdavis.edu Office: 132 SSH Office hours: TBA

  • J. Parman (UC-Davis)

World Economic History, Spring 2011 March 28, 2011 2 / 40

slide-3
SLIDE 3

General Details

We will have a course website (smartsite.ucdavis.edu) The syllabus, lecture slides, old exams and extra readings will all be posted to the site (under the ’Resources’ section) Lecture slides will typically be posted the morning of the lecture Try accessing smartsite at some point in the next couple of days to make certain you have access

  • J. Parman (UC-Davis)

World Economic History, Spring 2011 March 28, 2011 3 / 40

slide-4
SLIDE 4

Prerequisites

Officially, the prerequisites are ECN 1A, ECN 1B and ECN 110A You should have taken ECN 1A and 1B, I’ll assume a certain knowledge of economic terms and concepts from these courses It is fine if you haven’t taken 110A (although the first week may be slightly easier if you have taken 110A)

  • J. Parman (UC-Davis)

World Economic History, Spring 2011 March 28, 2011 4 / 40

slide-5
SLIDE 5

Wait list, open campus, permission to add, etc.

The economics department does not issue PTA numbers Everyone gets into the course through the waitlist Be careful about switching sections, paying fees late, etc. Open campus students should talk to me after class

  • J. Parman (UC-Davis)

World Economic History, Spring 2011 March 28, 2011 5 / 40

slide-6
SLIDE 6

Grading

Grades are based on two midterms (each worth 25% of the overall grade) and one final exam (worth 50%) The final course grades will be curved in line with the econ department rules (the average GPA for the class will be 2.7) There are no makeup exams, everyone must take the exam at the regularly scheduled time You have one week after an exam is first returned to raise any grading issues

  • J. Parman (UC-Davis)

World Economic History, Spring 2011 March 28, 2011 6 / 40

slide-7
SLIDE 7

Readings

The required text for the course will be “A Farewell to Alms” by Gregory Clark: There will be additional required readings posted on Smartsite (these will be shorter articles) I’ll also reference other readings that aren’t required but are worth exploring if any of the topics catch your interest

  • J. Parman (UC-Davis)

World Economic History, Spring 2011 March 28, 2011 7 / 40

slide-8
SLIDE 8

Schedule

Week of Monday Wednesday Friday March 28 lecture lecture no class April 4 lecture lecture lecture April 11 lecture lecture Midterm 1 April 18 lecture lecture lecture April 25 lecture lecture lecture May 2 lecture lecture Midterm 2 May 9 lecture lecture lecture May 16 lecture lecture lecture May 23 lecture lecture lecture May 30 Holiday lecture – Final Exam: Monday, June 6, 8am-10am

  • J. Parman (UC-Davis)

World Economic History, Spring 2011 March 28, 2011 8 / 40

slide-9
SLIDE 9

What The Course is About

5 6 7 8 9 ln (real GDP) ln (population) ln (real GDP per capita) 1 2 3 4 5 6 7 8 9 ln (real GDP) ln (population) ln (real GDP per capita) 1 2 3 4 5 6 7 8 9 1790 1840 1890 1940 1990 ln (real GDP) ln (population) ln (real GDP per capita)

US Growth, 1790-2008

  • J. Parman (UC-Davis)

World Economic History, Spring 2011 March 28, 2011 9 / 40

slide-10
SLIDE 10

What The Course is About

  • J. Parman (UC-Davis)

World Economic History, Spring 2011 March 28, 2011 10 / 40

slide-11
SLIDE 11

What The Course is About

  • J. Parman (UC-Davis)

World Economic History, Spring 2011 March 28, 2011 11 / 40

slide-12
SLIDE 12

Was Anything Happening in the Malthusian World?

  • J. Parman (UC-Davis)

World Economic History, Spring 2011 March 28, 2011 12 / 40

slide-13
SLIDE 13

Plenty Happened in the Malthusian World

Major technological advances: fire, tools, metal working, canals, windmills, explosives, domestication of plants and animals, math, astronomy, physics, etc. Exploration and trade across long distances occurred Empires came and went Some people became very, very wealthy but overall income per capita did not rise

  • J. Parman (UC-Davis)

World Economic History, Spring 2011 March 28, 2011 13 / 40

slide-14
SLIDE 14

Explaining the Malthusian Trap

The first part of the course will be explaining this Malthusian world Why did income per person stay constant for so long? Why weren’t technological advances leading to economic growth? Why didn’t the rise of empires, international trade, etc. lead to increases in average income?

  • J. Parman (UC-Davis)

World Economic History, Spring 2011 March 28, 2011 14 / 40

slide-15
SLIDE 15

Escaping the Malthusian Trap

The Industrial Revolution marked a break from the Malthusian Trap The second part of the course will be explaining what the Industrial Revolution actually was We’ll cover the technological improvements but these were just a part of what happened Other important features of the revolution:

Agricultural Revolution Industrious Revolution Demographic Transition

  • J. Parman (UC-Davis)

World Economic History, Spring 2011 March 28, 2011 15 / 40

slide-16
SLIDE 16

Escaping the Malthusian Trap

Why was it England that led this break from the Malthusian world? Why did the Industrial Revolution happen when it did? Why didn’t it happen sooner in other parts of the world? We’ll consider a variety of explanations:

Institutions Natural Resources Geography Evolutionary

  • J. Parman (UC-Davis)

World Economic History, Spring 2011 March 28, 2011 16 / 40

slide-17
SLIDE 17

The Great Divergence

  • J. Parman (UC-Davis)

World Economic History, Spring 2011 March 28, 2011 17 / 40

slide-18
SLIDE 18

The Great Divergence

What were the benefits of industrialization for Western European countries? Which segments of society benefited the most? Why did other countries not benefit from the Industrial Revolution? How do we explain the divergence in per capita income across countries since the Industrial Revolution?

  • J. Parman (UC-Davis)

World Economic History, Spring 2011 March 28, 2011 18 / 40

slide-19
SLIDE 19

Explaining the Malthusian Economy

  • J. Parman (UC-Davis)

World Economic History, Spring 2011 March 28, 2011 19 / 40

slide-20
SLIDE 20

Population in the Modern World

  • J. Parman (UC-Davis)

World Economic History, Spring 2011 March 28, 2011 20 / 40

slide-21
SLIDE 21

Population in the Preindustrial World

1500 2000 2500 3000 ation (in millions) 500 1000 1500 2000 2500 3000 0 BC 0 BC 0 BC 0 BC 0 BC 0 BC 0 AD 0 AD 0 AD 0 AD 0 AD 0 AD 0 AD 0 AD 0 AD 0 AD 0 AD 0 AD 0 AD 0 AD World population (in millions) 500 1000 1500 2000 2500 3000 10000 BC 6500 BC 4000 BC 2000 BC 500 BC 200 BC 200 AD 500 AD 700 AD 900 AD 1100 AD 1250 AD 1340 AD 1500 AD 1650 AD 1750 AD 1850 AD 1910 AD 1930 AD 1950 AD World population (in millions)

  • J. Parman (UC-Davis)

World Economic History, Spring 2011 March 28, 2011 21 / 40

slide-22
SLIDE 22

Population in the Preindustrial World

Location Population in 1300 Population in 1800 Surviving children per woman Norway 0.4 0.88 2.095 Southern Italy 4.75 7.9 2.061 France 17 27.2 2.056 England 5.8 8.7 2.049 Northern Italy 7.75 10.2 2.033 Iceland 0.084 0.047 1.93

  • J. Parman (UC-Davis)

World Economic History, Spring 2011 March 28, 2011 22 / 40

slide-23
SLIDE 23

Explaining Stationary Populations

One of the key differences between the preindustrial world and the modern world was that population size was pretty much static It turns out that there is a very simple economic argument for why this was the case The argument depends on three assumptions about how preindustrial economies worked:

Each society had a birth rate increasing with living standards Each society had a death rate decreasing with living standards Living standards decline as population increases

  • J. Parman (UC-Davis)

World Economic History, Spring 2011 March 28, 2011 23 / 40

slide-24
SLIDE 24

The Birth Rate Schedule

The birth rate is just the number of births per year per thousand people For example, there were 4,059,000 births in the United States in 2000 and the US population was 281,421,906: b2000 = 4059000

281421906 1000

= 14.4 We assume that in the preindustrial world, birth rates rose with material living standards Why? A wealthier family could better afford an additional child, a healthier woman was more likely to have a successful pregnancy, ...

  • J. Parman (UC-Davis)

World Economic History, Spring 2011 March 28, 2011 24 / 40

slide-25
SLIDE 25

The Birth Rate Schedule

  • J. Parman (UC-Davis)

World Economic History, Spring 2011 March 28, 2011 25 / 40

slide-26
SLIDE 26

The Death Rate Schedule

The death rate is just the number of deaths per year per thousand people For example, there were 2,403,000 deaths in the United States in 2000 and the US population was 281,421,906: d2000 = 2403000

281421906 1000

= 8.5 We assume that in the preindustrial world, death rates fell with material living standards Why? Higher levels of consumption (better food, clothing, shelter, etc.) helps you live longer

  • J. Parman (UC-Davis)

World Economic History, Spring 2011 March 28, 2011 26 / 40

slide-27
SLIDE 27

The Death Rate Schedule

  • J. Parman (UC-Davis)

World Economic History, Spring 2011 March 28, 2011 27 / 40

slide-28
SLIDE 28

Stationary Population

Notice that for our US figures, the birth rate was 14.4 births per 1,000 people per year and the death rate was 8.5 deaths per 1,000 people per year This means that each year, more people are being born than are dying so population must be growing Recall that the preindustrial world had almost no population growth So in the preindustrial world, the birth rate roughly equaled the death rate (the income per person at which this occurs is called the subsistence income)

  • J. Parman (UC-Davis)

World Economic History, Spring 2011 March 28, 2011 28 / 40

slide-29
SLIDE 29

Stationary Population

  • J. Parman (UC-Davis)

World Economic History, Spring 2011 March 28, 2011 29 / 40

slide-30
SLIDE 30

Stationary Population

But why a stationary population? Because of the technology curve relating population to income per person With some resources fixed (for example land), the marginal product of an extra person is positive but smaller than the marginal product of the previous person This means that while total output increases as population increases, it increases at a slower rate than population

  • J. Parman (UC-Davis)

World Economic History, Spring 2011 March 28, 2011 30 / 40

slide-31
SLIDE 31

Diminishing Marginal Product of Workers

  • J. Parman (UC-Davis)

World Economic History, Spring 2011 March 28, 2011 31 / 40

slide-32
SLIDE 32

The Technology Curve

  • J. Parman (UC-Davis)

World Economic History, Spring 2011 March 28, 2011 32 / 40

slide-33
SLIDE 33

The Malthusian Equilibrium

  • J. Parman (UC-Davis)

World Economic History, Spring 2011 March 28, 2011 33 / 40

slide-34
SLIDE 34

Moving to the Malthusian Equilibrium

Suppose we were at an income per person greater than the equilibrium level Then births would exceed deaths leading to population growth As the population grows, we move up and to the left along the technology curve This leads to lower income per person increasing the death rate and decreasing the birth rate Things stop moving once the birth rate equals the death rate

  • J. Parman (UC-Davis)

World Economic History, Spring 2011 March 28, 2011 34 / 40

slide-35
SLIDE 35

Moving to the Malthusian Equilibrium

  • J. Parman (UC-Davis)

World Economic History, Spring 2011 March 28, 2011 35 / 40

slide-36
SLIDE 36

Moving to the Malthusian Equilibrium

Notice that equilibrium income per person had nothing to do with the level of technology Equilibrium income per person is determined entirely by the birth rate and death rate The technology curve mattered for two reasons:

The downward slope told us how income per person would change if the population was growing or shrinking The position determined the equilibrium population level

  • J. Parman (UC-Davis)

World Economic History, Spring 2011 March 28, 2011 36 / 40

slide-37
SLIDE 37

The Effects of a Change in Technology

Suppose that there is an improvement in technology (we invent the wheel). What happens? The advance in technology will shift the technology curve to the right In the short run (before population adjusts), this means greater income per person Births will rise, deaths will fall and the population will grow The economy returns to the old income per person only at a new higher population So an improvement in technology can allow for greater population density but doesn’t improve average income per person

  • J. Parman (UC-Davis)

World Economic History, Spring 2011 March 28, 2011 37 / 40

slide-38
SLIDE 38

The Effects of a Change in Technology

  • J. Parman (UC-Davis)

World Economic History, Spring 2011 March 28, 2011 38 / 40

slide-39
SLIDE 39

The Effects of a Change in the Birth or Death Schedules

A shift in the birth or death schedules can change equilibrium income per person. Suppose that the plague comes along, what happens? The rise in disease will shift the death rate curve up (more deaths at any given income level) At the current income per person, deaths will now

  • utnumber births and the population will decrease

As the population decreases, income per person will rise until deaths once again equal births The economy settles at a new higher income per person and a new lower population

  • J. Parman (UC-Davis)

World Economic History, Spring 2011 March 28, 2011 39 / 40

slide-40
SLIDE 40

A Shift in the Death Rate Curve

  • J. Parman (UC-Davis)

World Economic History, Spring 2011 March 28, 2011 40 / 40