
SLIDE 1
- The Chester
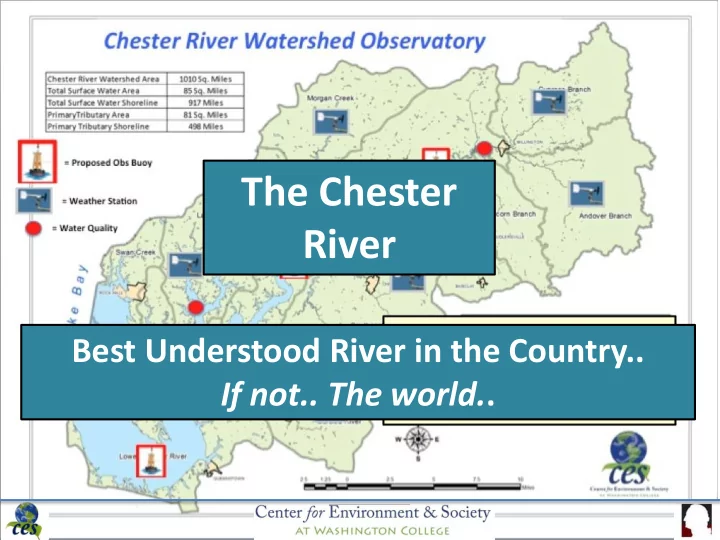
The Chester River Best Understood River in the Country.. If not.. - - PowerPoint PPT Presentation
The Chester River Best Understood River in the Country.. If not.. The world. . CES/GIS CES/GIS ? US IOOS Modeling Test Bed $4M - IOOS Program FFO 21 members Testbed Management (Programmatic Language) Estuarine
Testbed Advisory Evaluation Group
10 members Rich Signell, USGS
Estuarine Hypoxia Chesapeake Bay
Carl Friedrichs, VIMS 21 members
Coastal Inundation Gulf and East Coast
Rick Luettich, UNC-CH 24 members
Cyber Infrastructure
Eoin Howlett, ASA 25 members
Testbed Management
Doug Levin, IOOS Don Wright, Liz Smith, SURA
Shelf Hypoxia Gulf of Mexico
20 members John Harding, USM
(Programmatic Language)
Extension Dec 11
than the process
Ops
Analysis subsystem
Washington College CES Capabilities To Support/Calibrate(?) the Modeling Effort
Geographic Information Systems Laboratory Shallow Water Mapping System Chester River Watershed Observatory (Spring ‘15) 5 Buoys, 4 Fixed Stations 5 Weather Stations 2 ADCPS & I Current Meters NASA Radar Measurement of Precipitation MARACOOS Data Portal Data Fountain
$500 ea
Water Temperature Conductivity (Salinity) Dissolved Oxygen pH Current Velocity Water Level More…… Turbidity & Light Nutrients
Chapel District Kindergarten, Church Hill Middle School & the Kent School