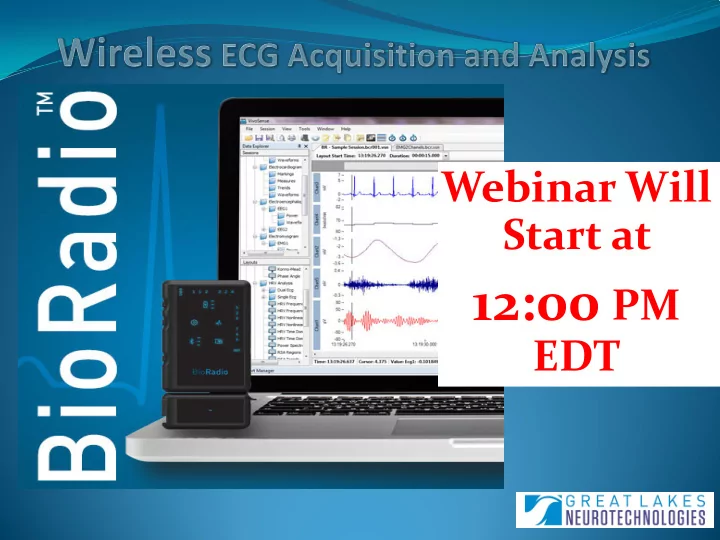

Webinar Will Start at 12:00 PM EDT
The BioRadio
Measurement of the electrical activity of the heart
Research and/or teaching in exercise physiology, psychophysiology, cardio-pulmonary applications
Snap electrode lead wires and surface adhesive electrodes
Common ECG Data Analysis Methods Heart rate analysis R-R interval measurement Heart Rate Variability
R-R Interval Measurement The distance between the peaks of the QRS complex within an ECG signal.
Heart Rate Variability • HRV is the variation in R-R intervals within the ECG signal. • Can provide information on underlying autonomic function • Caused by activity, physical/emotional stress, sleep apnea, smoking
Teaching and ECG Basics of ECG signal acquisition • Einthoven’s Triangle, 3-lead ECG, electrode placement and filtering Advanced signal collection and analysis • Blood pressure and ECG signal relationship, abnormal ECG signal detection and analysis, pulse oximetry Clinical ECG applications • Heart Rate Detection, biofeedback
The effects of blood glucose changes on frequency- domain measures of HRV signal in type 1 diabetes Amanipour, R. ; Electr. Eng. Dept., Univ. of Texas at El Paso, El Paso, TX, USA ; Nazeran, H. ; Reyes, I. ; Franco, M. The analysis of time duration between consecutive R waves of electrocardiogram (ECG) is a standard method to evaluate the variations in heart rate. The physiological literature reveals that blood glucose levels modulate the autonomic nervous system (ANS) activity and heart rate variability (HRV) is representative of the cardiovascular autonomic function. In the research described here, a pilot investigation was carried out to investigate the relationship between HRV signal measures derived from ECG and arterial blood glucose changes in a female subject with type 1 diabetes mellitus (T1DM) subject during normoglycemic and mildly hyperglycemic conditions. A CleveLabs BioCapture wireless device was used to acquire ECG signals from a 160 Kg, 59.6 year old female volunteer with type 1 diabetes. The PhysioToolkit Software was used to extract the HRV signal and the Kubios software package was deployed to perform comprehensive HRV signal analysis. This software has an easy-to-use graphical user interface that displays the HRV signal and provides three options to calculate: Time-domain, Frequency-domain and Nonlinear Dynamics parameters from raw HRV signals. In its Frequency-domain analysis section, it provides frequency bands such as VLF (Hz), LF (Hz), and HF (Hz), with LF/HF as an index that reflects the sympathovagal balance of the ANS. ECG data were acquired for 30 minutes during normoglycemic condition and for another 30 minutes during mildly hyperglycemic conditions, while blood glucose levels were measured manually by the subject using a glucometer every 5 minutes. ECG signal segments of 5 minute durations were then processed to extract HRV signals and these in turn were analyzed to provide frequency-domain measures. The results indicated that blood glucose changes were inversely related to LF/HF. For this dataset, it was observed that mean ± std of the LF/HF decreased from 6.0 ± 1.04 to 0.91 ± 0.17 when blood glucose levels increased from 156- ± 22 mg/dl to 202 ± 29 mg/dl. Further investigation is underway to recruit more diabetic subjects to acquire a large dataset and explore the relationships between different HRV signal parameters and blood glucose changes under different gylcemic conditions in a comprehensive way.
BioRadio Fetal heart rate
References Brüser, Christoph; Stadlthanner, Kurt; de Waele, Stijn; Leonhardt, Steffen (2011). "Adaptive Beat-to-Beat Heart Rate Estimation in Ballistocardiograms". IEEE Transactions on Information Technology in Biomedicine (IEEE) 15 (5): 778786. Using LabVIEW for Heart Rate Variability Analysis. 2012. Retrieved from http://zone.ni.com/devzone/cda/epd/p/id/5832 Stein P, et. al. Heart Rate Variability to Assess Autonomic Function. Washington University School of Medicine. Vivonoetics. 2012. VivoSense User Manual – Heart Rate Variability Professional Edition. Amanipour, R. ; Electr. Eng. Dept., Univ. of Texas at El Paso, El Paso, TX, USA ; Nazeran, H. ; Reyes, I. ; Franco, M. “The effects of blood glucose changes on frequency-domain measures of HRV signal in type 1 diabetes”. Electrical Communications and Computers (CONIELECOMP), 2012 22nd International Conference
Questions? Marcelo Aller Global Sales Manager 330.990.0781 maller@glneurotech.com http://vivonoetics.com/videos/HRV_Module_Video/HRV_Module_Video.html https://www.youtube.com/watch?v=Q6JYLHiZz8I Follow us
Recommend
More recommend