
SLIDE 1
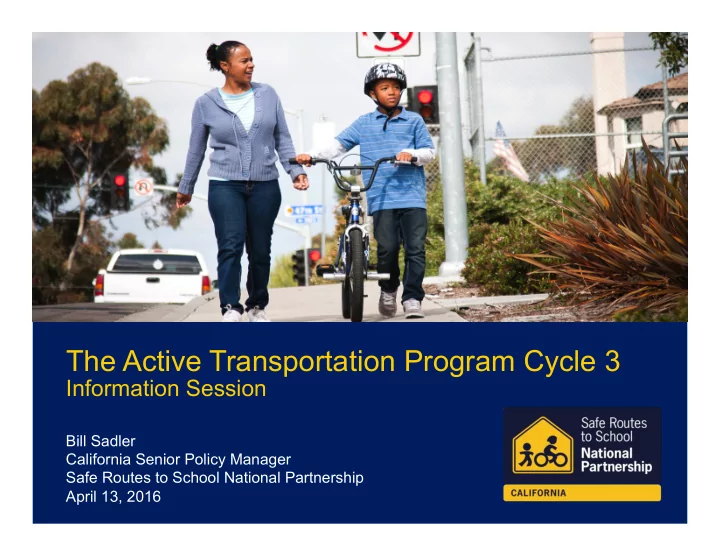
The Active Transportation Program Cycle 3
Information Session
Bill Sadler California Senior Policy Manager Safe Routes to School National Partnership April 13, 2016
The Active Transportation Program Cycle 3 Information Session Bill - - PowerPoint PPT Presentation
The Active Transportation Program Cycle 3 Information Session Bill Sadler California Senior Policy Manager Safe Routes to School National Partnership April 13, 2016 DISCLAIMER This is NOT a Caltrans-endorsed webinar Caltrans will be
Information Session
Bill Sadler California Senior Policy Manager Safe Routes to School National Partnership April 13, 2016
ATP after the call for application is released
the ATP development process and serve on ATP Technical Advisory Committee and are sharing what we know with you.
information, the call for applications is not yet available and some information may change.
Open or hide your control panel Join audio:
using numbers on screen OR
your computer’s sound AUDIO
If you have questions, you can enter them in the Question box and we will answer them throughout the webinar and at the end during the Q&A session. QUESTIONS
http://saferoutescalifornia.org/funding-workshops-and- webinars/
http://saferoutescalifornia.org/funding-workshops-and- webinars/
bicycling and walking, especially for children traveling to school and for residents of disadvantaged communities.
which consolidated other federal & state active transportation funding programs into one program.
walking,
to achieve greenhouse gas (GHG) reduction goals, pursuant to SB 375 (2008) and SB 341 (2009),
benefits of the program, and
active transportation users.
bicycle projects)
and encouragement programs, including Safe Routes to School)
communities)
non-infrastructure projects
bulb outs, signals/signage, etc
bike lanes, secure bike parking, etc
encourage walking and bicycling for children on the trip to school
access to bus or train stations and school bus stops
communities without an existing plan)
audits
§ Project must increase safety and access for public school students to walk and/or bike to school. § For infrastructure projects, must be located within two miles of a public school or within the vicinity of a public school bus stop. § Non-infrastructure projects have no location restriction, unless they are traffic education & enforcement activities (then 2- mile radius applies)
§ Local, regional, or state agencies § Transit agencies § Tribal governments § Natural resources or public land agencies § Nonprofit organizations in limited cases
§ Currently, only for Rec Trails and must benefit the public § New federal transportation bill allows nonprofits to apply for active transportation funding but guidance from FHWA will not be out in time for Cycle 3
§ Public health departments § Public schools or school districts
*Others can partner with an eligible applicant and must follow Caltrans procedures for interagency agreements and sub-awards
– 75% in disadvantaged communities – Around half included SRTS components
– 88% in disadvantaged communities – Around half again included SRTS components
program!
combined NI/infrastructure projects
Statewide Competition 50% Large Urban MPO Competitions 40% Small Urban & Rural Competition 10%
Two years of funding (FY2019/20, 2020/21)
§ 25% min for disadvantaged communities § 2% max for planning in disadvantaged communities
All communities are eligible to apply to the Statewide Competition
$120M
§ 25% min for disadvantaged communities § 2% max for planning in disadvantaged communities
Communities in urban regions with populations greater than 200,000 are eligible for the Large Urban MPO Competitions
$96M
MPOs receive a proportional share of funding based on population
§ 25% min for disadvantaged communities
Communities in rural regions or in urban regions with populations under 200,000 are eligible for the Small Urban & Rural Competition.
within an MPO receiving a regional allocation)
$24M
Statewide Competition 50% Large Urban MPO Competitions 40% Small Urban & Rural Competition 10%
1) Highest scoring projects selected by CTC 2) Remaining projects selected by CTC 3) Remaining projects scored and selected by each MPO
Committee to assist in evaluating applications.
infrastructure, non-infrastructure, Safe Routes to School and planning projects.
may change for this cycle.
Date Milestone April 15 Call for applications released April to May Caltrans will be holding workshops during the application process. Dates, times & locations are TBD. June 15 Application deadline June to August MPOs may hold separate call for applications (i.e. MTC, SACOG) October 28 Awards announced for state & rural allocations December 7-8 California Transportation Commission approves state & rural awards January 27, 2017 Awards announced for MPO allocations March 2017 CTC approves MPO awards
and 25% set-aside, but revised criteria and application question.
and new elements of existing programs now allowed (previously only startup programs)
will be available even though awards given out this year
not be considered for funding in the Active Transportation
committed funds.
projects listed in Section 11 of these guidelines.
Benefits to disadvantaged communities
0 to 10 points
Potential for increased walking & bicycling, especially students
0 to 35 points 0 to 10 points 0 to 5 points 0 to 5 points
Potential for improving safety (reducing injuries & fatalities) Public participation & planning Cost effectiveness Leveraging of non-ATP funds Partnering with Conservation Corps
0 to 10 points
Improved public health
0 to 25 points
Past performance on ATP funded projects
WHY INVEST IN DISADVANTAGED COMMUNITIES?
must flow to projects benefiting disadvantaged communities.
communities and address historic patterns of disinvestment in low-income communities and communities of color.
Californians have access to safe, walkable and bikeable communities regardless of race, place or income.
GUIDELINES CLARIFICATIONS RE BENEFIT TO DISADVANTAGED COMMUNITIES
direct, meaningful, and assured benefit to a disadvantaged community.
need of low-income people in a way that provides a significant benefit and targets its benefits primarily to low-income people while avoiding substantial burdens on a disadvantaged community.
– Located within or in reasonable proximity and have a direct connection, to the disadvantaged community served by the project; or – Must be an extension or a segment of a larger project that connects to
project benefits the disadvantaged community;
Income-Based
Quantitative Assessment
Cycle 2 Cycle 3 CalEnviroScreen School-Based Income-Based
Quantitative Assessment*
CalEnviroScreen School-Based Alternative Criteria Alternative Criteria
Regionally Defined Tribes
*Requirements changed
Income-Based
The community’s median household income is less than 80% of the statewide median (<$49,191) based on 2010-2014 American Community Survey data at the Census tract level.
http://factfinder.census.gov/faces/nav/jsf/ pages/index.xhtml
Cycle 3 Changes
specified
population less than 15,000 may use Census block group level data
communities may use Census Place level data
CalEnviroScreen
An area identified in the top 25% of scores based on the California Communities Environmental Health Screening Tool.
http://www.calepa.ca.gov/EnvJustice/ GHGInvest/
School-Based
At least 75% of public school students in the project area are eligible for free or reduced price meals.
http://www.cde.ca.gov/ds/sd/sd/filessp.asp
Cycle 3 Changes
benefits the school students in the project area.
be used as measure representative of the larger community’s DAC status.
this criteria.
Alternative Criteria: Quantitative Assessment
to demonstrate that the community’s median household income is at or below 80% of that state median household income.
Cycle 3 Changes
neighborhoods and/or unincorporated communities
to a lack of accurate Census data or CalEnviroScreen data
demonstrate community’s Median Household Income
Alternative Criteria: Regionally Defined
Regional definitions of disadvantaged communities as adopted in a Regional Transportation Plan (RTP) by an MPO or RTPA per obligations with Title VI of the Federal Civil Rights Act of 1964.
Cycle 3 Changes
DACs could include
such as “environmental justice communities” or “communities of concern”
Alternative Criteria: Tribes
Projects located within Federally Recognized Tribal Lands (typically within the boundaries of a Reservation or Rancheria).
0 points: Identification
Cycle 2 Cycle 3* 5 points: % Project Located Within DAC 5 points: Direct, Meaningful, & Assured Benefit to DAC
*Based on March 30, 2016 draft application; subject to change
DISADVANTAGED COMMUNITIES SCORING CRITERIA
0 points: Required Project Map 0 points: Identification
5 points: Direct Benefit & Project Location 5 points: Degree of DAC Severity
10 Points available
0 points (screening) Map of project boundaries 0 points (screening) Identification of DACs: select from 4 options: income; CalEnviroScreen; free & reduced price meals; or alternative criteria 5 points Direct Benefit & Project Location: A) Gap closure, provides connections, addresses a deficiency
B) Explain how residents will have physical access to the project/program/plan C) Illustrate how project requested/supportive by residents D) Percentage of project located in DAC 5 points Severity (auto calculated) *Based on March 30, 2016 draft application; subject to change
DISADVANTAGED COMMUNITIES SCORING CRITERIA*
community.
community conditions, needs, barriers, etc.
community’s unique needs.
strategies and incorporates input.
KE KEY ELE LEMENT NTS OF OF SUC UCCESSFUL FUL DISADVANT NTAGE GED COM OMMUNI UNITY PROJE OJECTS
QUESTION 2: POTENTIAL TO INCREASE WALKING & BICYLING
35 Points available
“Potential for increase walking and bicycling, especially among students, including the identification of walking and bicycling routes to and from schools, transit facilities, community centers, employment centers, and other destinations; and including increasing and improving connectivity and mobility of non-motorized users.” 0 points (screening) Current and projected types and numbers/rates of pedestrians & bicyclists in the project area. 15 points Describe active transportation need that project addresses. 15 points How does project address that need? A) Gap closure B) Create new route C) Remove barrier D) Other improvement to route E) Plan for increasing walking & biking F) Encouragement & education 5 points Why is project one of agency/community’s highest priorities?
QUESTION 3: POTENTIAL FOR IMPROVING SAFETY
25 Points available
“Potential for reducing the number and/or rate or the risk of pedestrian and bicyclist fatalities & injuries, including the identification of safety hazards for pedestrians and bicyclists.”
10 points Describe the plan/program influence area or project location’s history of pedestrian and bicycle collisions resulting in fatalities and injuries to non-motorized users that the project directly mitigates and the source(s) of data used (e.g. collision reports, community observation, surveys, audits).
15 points Safety countermeasures – how does project address one or more of the following: A) Reduces speed/volume of cars B) Improves sight distance & visibility C) Eliminates conflict points D) Improves compliance with local traffic laws E) Addresses inadequate traffic control devices F) Addresses inadequate/unsafe facilities G) Eliminates or reduces behaviors that lead to collisions
QUESTION 4: PUBLIC PARTICIPATION & PLANNING
10 Points available
“Describe the community based public participation process that culminated in the project/ program proposal or will be utilized as part of the development of a plan.” 3 points What: The process for defining future policies, goals, investments & designs to prepare for future needs of users of the project. 3 points Who: Was/will be engaged in the identification and development of this project/program/plan (for plans: who will be engaged). Provide documentation of type, extent & duration of outreach. 3 points What: Feedback received during stakeholder engagement process & how the process has improved the project’s overall effectiveness at meeting the purpose & goals of ATP. 1 point How will stakeholders continue to be engaged in implementation of the project?
QUESTION 5: IMPROVED PUBLIC HEALTH
10 Points available
NOTE: Applicants applying for the disadvantaged community set aside must respond to the below questions with health data specific to the disadvantaged communities. All applicants must cite information specific to project location and targeted users. Failure to do so will result in lost points. 5 points Describe the health status of the targeted users of the project/program/plan. 5 points Describe how you expect your project/proposal/plan to enhance public health and outreach to the targeted users.
QUESTION 6: COST-EFFECTIVENESS
5 Points available
A project’s cost effectiveness is considered to be the relative costs of the project in comparison to the project’s benefits as defined by the purpose and goals of the ATP. This includes the consideration of the safety and mobility benefit in relation to both the total project cost and the funds provided. 5 points Explain why the project is considered to have the highest Benefit to Cost Ratio (B/C) with respect to the ATP purpose and goals of “increased use of active modes of transportation”.
guidelines
project phase (permits and environmental studies; plans, specifications, and estimates; right-of-way; and construction).
projects in Cycles 1 and 2:
projects
Routes to School projects
examples, best practices and tips for non-infrastructure projects
communities without an existing plan)
audits
program has existed before
SRTS programs
elements to existing programs will also be considered, if they can show the existing program will be sustained with non-ATP funds
will the program be sustained after the ATP grant?
infrastructure projects
§ Project must increase safety and access for public school students to walk and/or bike to school. § For infrastructure projects, must be located within two miles of a public school or within the vicinity of a public school bus stop. § Non-infrastructure projects have no location restriction, unless they are traffic education & enforcement activities (then 2- mile radius applies)
Non-Infrastructure Work Plan: http://www.dot.ca.gov/hq/ LocalPrograms/atp/documents/ 2016/ Exhibit_22_NI_Work_Plan.xlsx
Guidance: http://www.dot.ca.gov/hq/ LocalPrograms/atp/documents/ 2015/ATP-Non-Infrastructure- Guidance-2015-06-11.pdf
http://saferoutescalifornia.org/srts- atp-funding/applying-for-atp-funds/ submit-an-atp-question/
Coordinator (for one school)
expenses needed for coordination & training efforts (supplies, meals, materials, mileage reimbursements)
encouragement materials
Caltrans in order to be reimbursed.
by Caltrans in advance of purchase on a project-by-project basis
program beyond the lift of the ATP grant as part of a sustainable NI/SRTS program in the community
progam work/duties
bottles, etc.
NI ALLOWABLE EXPENSES: DIRECT PROGRAM-RELATED EXPENSES
student body whether or not they participate in a SRTS activity
achievement in the SRTS program over the course of a school year
year, per school)
coordination & training efforts
tables & chairs for sign-in areas, shade tents and easels
the program For more information on Non-Infrastructure Expenses, see Caltrans Guidance: http://www.dot.ca.gov/hq/LocalPrograms/atp/documents/2015/ATP- Non-Infrastructure-Guidance-2015-06-11.pdf
ELEMENTS OF SUCCESSFUL NI PROGRAMS FROM PREVIOUS ATP CYCLES
Health Agencies.
implementation.
models, ATP ‘Ambassador’ programs)
ELEMENTS OF SUCCESSFUL NI PROGRAMS FROM PREVIOUS ATP CYCLES
work.
infrastructure available to all or most participating sites
ends
April 13, 2016
future grants
encompassing disadvantaged communities
most MPO regional programs
program applications
plans should address travel to school and include school-based education & encouragement programs
eligible applicants to ATP
required to be included in active transportation plans
Baseline & Projected Conditions
walking & biking (# & %)
would walk & bike (# & %)
where? (# & %)
collisions would be prevented?
and biking to? (existing and proposed land use)
Proposed Actions
facilities will you install?
their bikes?
transit via bike? How will people know where they’re going?
everything?
encourage, and enforce?
Engagement
communities in these decisions, particularly disadvantaged residents?
coordinate with other agencies (schools, nearby cities, regional agencies)?
Action Plan
compare to what you’ve already spent?
what you accomplish? Resolution of Adoption
based organization
communities you don’t?
partners can you engage?
team
Eric Bruins Planning & Policy Director Los Angeles County Bicycle Coalition eric@la-bike.org
health department, community-based organizations, schools,
rates for question 2, injuries & fatalities for question 3, public health for question 5
visuals throughout the application to help the evaluator understand your project
groups, academic institutions, etc.
student tallies, parent surveys, etc.
workshops, surveys, photos, media stories, etc.)
Jeanie Ward-Waller Policy Director jeanie@calbike.org April 13, 2016
x
Ques;on 1: Disadvantaged Community Benefit Answers from awardees included…
CalEnviroscreen, below 80% of Median Household Income, or access a low-income school
census tract boundaries
the project
Answers from awardees included…
www.saferoutesinfo.org/data-central/data-collec$on-forms
jobs, schools, services
Answers from awardees included…
h`p://$ms.berkeley.edu/
pedestrians, cyclists, and motorists
“In the 2009 California Office of Traffic Safety (OTS) safety rankings… Inglewood ranked 5th out of 56 cities for … pedestrian casualties.” “Inglewood ranked 6th out of 56 for … pedestrians killed.” “From 2008 to 2010, there were 131 pedestrian and 58 bicyclist casualties in Inglewood.”
awardee
Answers from Awardees included…
meaningful, accessible input opportuni$es
“The County has a long history of proactive involvement with stakeholders… the Florence-Firestone Community Enhancement Team (Team) … staff from different County Departments, including the Sherriff, and Departments
Works… working with local schools and community stakeholders such as the Florence-Firestone Community Leaders (FFCL) to address quality of life issues such as code enforcement, economic development, and traffic safety in the community.”
Answers from Awardees included…
and other health experts
pollu$on exposure and asthma rates: h`p://oehha.ca.gov/ej/ces2.html
“The Florence-Firestone community is located in the economically disadvantaged South Los Angeles area… exposed to high concentrations of Ozone, Particulate Matter 2.5, and Diesel Particulate Matter emissions according to CalEnviroScreen (CES) data… due to the proximity of major freeways and high traffic density. The CES data also shows a prevalence for asthma related hospital visits in the area, which can be attributed to traffic pollution. The Florence-Firestone Community has an adult obesity rate of 38.7% and a childhood obesity rate of 31% based on 2008 data compiled by the County's Department of Public Health (DPH). The prevalence of childhood obesity is determined by using body mass index (BMI) measurements of 5th, 7th, and 9th grade public school children from the annual California Physical Fitness Testing Program.”
Jeanie Ward-Waller Policy Director jeanie@calbike.org 916-399-3211
questions: http://saferoutescalifornia.org/srts-atp-funding/ applying-for-atp-funds/submit-an-atp-question/
during the webinar.
State: Bill Sadler bill@saferoutespartnership.org (847) 732-4007 Bay Area/Northern CA: Marty Martinez marty@saferoutespartnership.org (415) 637-6488 Southern California: Demi Espinoza demi@saferoutespartnership.org (503) 739-3654
Teresa McWilliam Caltrans ATP Program Manager (916) 653-0328 teresa.mcwilliam@dot.ca.gov Laurie Waters California Transportation Commission (916) 651-6145 laurie.waters@dot.ca.gov
– http://www.dot.ca.gov/hq/LocalPrograms/atp/ – http://www.catc.ca.gov/programs/ATP.htm – http://saferoutescalifornia.org/srts-atp-funding/
– California Active Transportation Safety Program:
www.casaferoutestoschool.org